

$255 Solana? Supply Shock Fuels Bullish Forecast

Source Newsbtc

Solana opened August trading in a tight range just above $165. The coin has hovered near that level after a sharp run-up. Based on reports, big holders rotating profits and deeper DeFi ties are reshaping the outlook for SOL.

Solana Holds Critical Support Zone

According to on-chain data, SOL has formed what looks like a Golden Cross on its daily chart, where the 50-day moving average crossed above the 200-day line.

A pullback to around $160 has lined up with both the 200 EMA and a key trendline. Analysis shows that the $161–$166 area has become a firm floor.
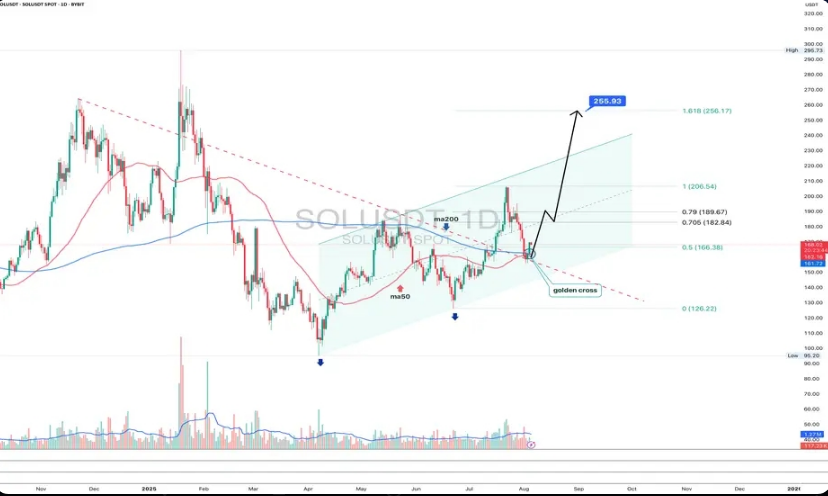
If buyers defend that pocket, SOL could climb toward the first barrier near $189 and then test $206. Analyst Mary Emerald has penciled in a move up to $256, a gain of about 60% from today’s prices.

On its own, SOL has already jumped more than 50% from earlier lows this year. Prices still face pressure, though. The MACD histogram is negative and hasn’t shown a clear turn upward.

That hints that bears have some edge until momentum shifts. Keeping an eye on trading volume around $189 will be key. A strong break and close above that level could open the door to higher targets.

New Mobile Phone Starts Shipping In 50 Countries

Meanwhile, with the long-awaited Seeker phone now available in over 50 countries, traders are growing more optimistic about Solana’s price as they eye a possible breakout.

The handset combines Web3 functionality with a familiar smartphone experience, using hardware-level security to keep private keys and seed phrases completely separate from the app layer.

This development makes Solana a more appealing platform for developers, fuels a vibrant ecosystem and expands SOL’s role as a utility token.

Forecasts Suggest Modest Gains Ahead

Based on the latest Solana price prediction, SOL is set to rise by 5.28% and reach $173 by September 5, 2025. Over the past 30 days, SOL has recorded 16/30 green days with 7.66% volatility. Current sentiment reads as neutral and the Fear & Greed Index sits at 50.
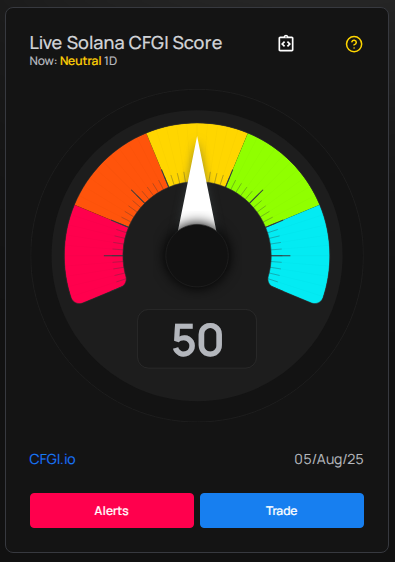
Looking at these metrics, a move toward $173 by early September seems likely if SOL can hold above $166. Failing that, a drop to $58 could prompt a deeper test of support.

If buyers can lock in gains around $165 and power SOL above $189 on solid volume, the path to $206—and maybe even $256—comes into view.

Until that happens, though, traders may want to wait for clearer signs that momentum has flipped.

Featured image from Nansen Research, chart from TradingView

Disclaimer: For information purposes only. Past performance is not indicative of future results.
placeholder
October hike odds climb toward 60% as Goldman and BofA both flip — what Warsh's "dose of accommodation" really changedRate futures now price roughly 55% to 62% for a 25bp hike at the October 27-28 FOMC, up from about 30% before Chair Warsh's post-meeting framing that the Fed is merely "removing some accommodation." Goldman Sachs has added an October hike to its forecast and Bank of America now sees moves in both October and December. Here is the repricing, the language behind it, and the two data points that decide it.
Author  Irene Q.
Sep 23, Wed
Rate futures now price roughly 55% to 62% for a 25bp hike at the October 27-28 FOMC, up from about 30% before Chair Warsh's post-meeting framing that the Fed is merely "removing some accommodation." Goldman Sachs has added an October hike to its forecast and Bank of America now sees moves in both October and December. Here is the repricing, the language behind it, and the two data points that decide it.
placeholder
Hurricane Isaias has shut in a quarter of Gulf oil output — can WTI clear $92 before Thursday's EIA report?WTI trades at $90.80 after rebounding roughly 3% from Wednesday's $87.96 low as Hurricane Isaias — the Atlantic season's first — forces producers to shut in about 25% of US Gulf of Mexico output. Brent holds at $103.41. The first official read on the disruption arrives with the EIA weekly petroleum report on Thursday 15 October — here are the key levels and both scenarios.
Author  Irene Q.
Oct 09, Fri
WTI trades at $90.80 after rebounding roughly 3% from Wednesday's $87.96 low as Hurricane Isaias — the Atlantic season's first — forces producers to shut in about 25% of US Gulf of Mexico output. Brent holds at $103.41. The first official read on the disruption arrives with the EIA weekly petroleum report on Thursday 15 October — here are the key levels and both scenarios.
placeholder
Gold Price Forecast: Gold Rebounds Above $4,200, Can Falling Oil Prices Drive Another Rally?As of Friday (October 9), gold prices (XAUUSD) rebounded noticeably after consecutive declines. During today's Asian session, gold prices briefly rebounded above $4,200, reaching an intra
Author  TradingKey
Oct 09, Fri
As of Friday (October 9), gold prices (XAUUSD) rebounded noticeably after consecutive declines. During today's Asian session, gold prices briefly rebounded above $4,200, reaching an intra
placeholder
US September CPI preview: inflation set to hit 3.7% — will the Fed hike in December?US September CPI lands Wednesday with headline inflation seen at 3.7% y/y and core at 0.2% m/m. December hike odds sit near 70% — here are the scenarios, the calendar and the key levels.
Author  Irene Q.
Oct 10, Sat
US September CPI lands Wednesday with headline inflation seen at 3.7% y/y and core at 0.2% m/m. December hike odds sit near 70% — here are the scenarios, the calendar and the key levels.
placeholder
Gold posts first weekly gain in three weeks — can $4,200 hold through CPI?Spot gold closed at $4,194.645, up 1.47% — its first weekly gain in three weeks — and COMEX futures settled back above $4,200 at $4,220.30. Here are the drivers, the levels and the scenarios into Wednesday's CPI.
Author  Irene Q.
Oct 10, Sat
Spot gold closed at $4,194.645, up 1.47% — its first weekly gain in three weeks — and COMEX futures settled back above $4,200 at $4,220.30. Here are the drivers, the levels and the scenarios into Wednesday's CPI.
goTop
quote