
WTI Crude consolidates near $61 after sharp drop, pressured by rising stockpiles and Iran outlook
- WTI trades lower near $61.20 on Thursday, pressured by rising US stockpiles and renewed hopes for an Iran deal.
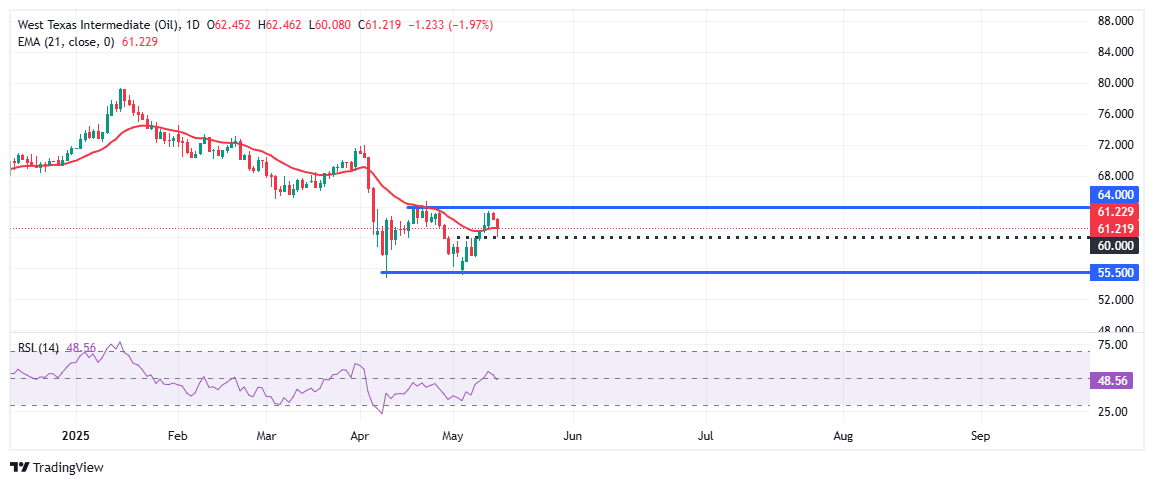
- Price finds interim support at $60.00 after falling over 3% intraday, with recovery capped at the 21-day EMA.
- Broader range holds between $55.50 and $64.00, with bearish catalysts dominating.
West Texas Intermediate (WTI) Oil remains under pressure on Thursday, trading near $61.20 during the American session after declining for a second straight day. The commodity briefly fell over 3% earlier in the day before finding near-term support at the $60.00 psychological level.
The latest leg down is driven by a combination of bearish supply-side fundamentals and technical rejection near key resistance. Renewed optimism surrounding a potential US-Iran nuclear agreement has revived expectations of increased Iranian oil hitting global markets, should sanctions be eased. This has triggered fresh concerns over an oversupplied environment, pressuring crude prices.
Additionally, the latest inventory data has fueled downside pressure. The US Energy Information Administration (EIA) reported an unexpected 3.5 million-barrel build in Crude Oil stockpiles last week, sharply contrasting with the market's forecast of a 1.1 million-barrel draw. The bearish tone was reinforced by the American Petroleum Institute (API), which recorded a further 4.3 million-barrel inventory increase.
Meanwhile, the Organization of the Petroleum Exporting Countries (OPEC) revised its 2025 forecast, trimming projected supply growth from the US and other non-OPEC+ producers to 800,000 barrels per day, down from the earlier 900,000 bpd estimate. However, the group's commitment to gradually increasing the output remains a bearish overhang for oil prices.
From a technical standpoint, the intraday decline found support at the $60.00 psychological mark, triggering a mild bounce. However, the rebound appears limited, with price action now struggling near the 21-day Exponential Moving Average (EMA), currently at $61.24. This dynamic level has flipped into short-term resistance after being breached earlier in the week.
From a broader perspective, WTI remains rangebound between key levels of $55.50 and $64.00. The recent failure to clear $64.00 — a horizontal resistance aligned with prior swing highs — has left bulls on the defensive, particularly as technical momentum begins to fade. On the downside, immediate support lies at $60.00, followed by the previous week's low near $55.50.A break below this zone would likely confirm a bearish continuation and expose further losses toward the $52.00 handle.
To the upside, bulls need to reclaim the 21-day EMA on a daily closing basis to regain short-term control. A sustained move above $61.24 could pave the way for a fresh test of the $64.00 resistance zone, with further upside potential toward $66.80.
Recommended Articles


