
Gold Pulls Back from Record Highs: Is It Time to Buy?
TradingKey - According to Bespoke Research, gold prices have set a new 52-week high 24 times over the past three months, with another record high reached on Tuesday.
However, on last Wednesday, gold suffered its largest single-day drop in nearly four years, raising questions about whether the rally to record levels has run out of steam. Analysts believe gold has further downside potential — though they emphasize that a sudden stop in the rally does not necessarily signal a long-term peak for prices.
Source: Goldman Sachs
Michael Armbruster, co-founder and managing partner at futures brokerage firm Altavest, commented that gold prices could "drop another $100" in the short term.
Technical Indicators Point to Ongoing Gold Correction
The daily Relative Strength Index (RSI) approached 80 earlier last week, while the weekly RSI is well above 80 — both levels are historically seen as overbought. The monthly RSI is near 87, similar to cycle peaks observed in 2011 and 2020.
Perhaps even more striking is gold’s distance from its 200-week moving average — a gap of over $1,400, representing a premium of about 67%. Such extreme deviations from long-term trend lines have historically signaled the need for a market correction.
Jonathan Krinsky, Chief Market Technician at BTIG, noted in a report that, as of last Tuesday, gold was trading about 27% above its 200-day moving average — a level rarely exceeded over the past 30 years. Krinsky views this as a sign that gold may have entered a "blow-off" phase. In trader speak, a "blow-off top" describes a sharp, accelerated rise in prices that can often be followed by a steep pullback.
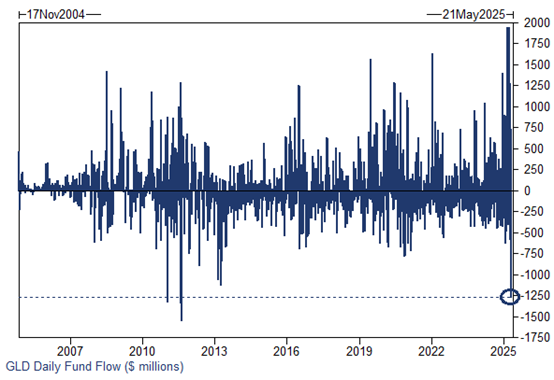
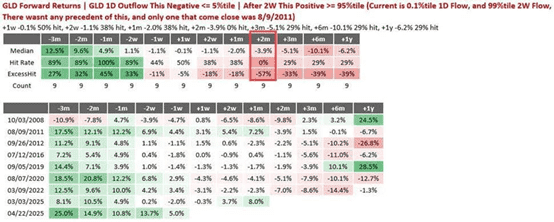
Moreover, abnormal fund flows point to a potential cooling-off period after a phase of excessive enthusiasm. Data shows that GLD (SPDR Gold Trust) experienced inflows exceeding the 95th percentile of historical levels over a two-week period, only to see a single-day outflow also surpassing the 95th percentile shortly afterward. Analysts at Nomura argue this reflects "late-stage buyers/weak hands" exiting positions, which could trigger broader selling pressure.
Historically, this "massive in-and-out" pattern has occurred only nine times — eight of which were followed by material pullbacks in gold, often concentrated in the next two months.
Source: Nomura
While macroeconomic factors may still support gold in the medium term, a period of consolidation appears likely.
Fundamentals Remain Supportive for Gold
One factor behind the recent weakness in gold is changing sentiment around global trade tensions. President Donald Trump indicated a possible willingness to lower tariffs on China, sparking hopes for a more conciliatory U.S. stance.
Despite this, gold is still supported by strong physical demand from central banks, heightened stagflation concerns, continued global uncertainties, and persistent geopolitical tensions.
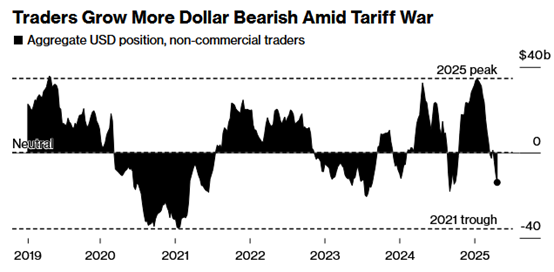
Additionally, the U.S. dollar rebounded somewhat last week, leading some investors to interpret this as a sign of stabilization. However, there remains significant potential for outflows from U.S. assets — a trend that could continue until the Federal Reserve begins cutting rates, a U.S.–China trade deal is reached, or consumer spending remains resilient.
Further weakness in the dollar would provide additional support for safe-haven demand for gold.
Source: Bloomberg
Is It Time to Buy Gold?
Goldman Sachs points out that while ETF assets under management (AUM) have hit record highs on the surface, the actual physical gold holdings of U.S.-listed ETFs remain well below 2020 levels.
While occasional ETF outflows are to be expected, the gap between ETF holdings and spot prices suggests there is still plenty of room for ETF demand to catch up. Thus, while sharp daily sell-offs like Wednesday’s are within expectations, Goldman believes that ETF buying will inevitably resume.
Meanwhile, Bank of America strategist Michael Hartnett argues that the market is shifting from an "American exceptionalism" narrative to an "American rejection" theme. He views the ongoing devaluation of U.S. assets as a clear investment trend — and gold’s surge is a direct reflection of that. Hartnett advises investors to buy gold on pullbacks.
Against a backdrop of rising global uncertainty, the relationship between gold and gold mining stocks has tightened further.
Gold miners — such as those held by ETFs like the VanEck Gold Miners ETF (GDX) or iShares Gold Producers ETF — are considered attractive for investors willing to take on more risk in pursuit of higher returns. These ETFs remain highly correlated with gold prices and in some cases offer dividend yields.
James Ferguson, a macro strategist at Bank of America, notes that gold miners have lagged gold prices by a surprising margin, offering potential for catch-up growth.
Recommended Articles


