


Silver Price Forecast: XAG/USD falls to near $33.00, further consolidation cannot be ruled out
- Silver price attracts some sellers to around $33.15 in Thursday’s early European session, down 2.25% on the day.
- The positive view of Silver prevails above the key 100-day EMA, but further consolidation cannot be ruled out.
- The immediate resistance level emerges at $34.23; the first support level to watch is $32.66.
The Silver price (XAG/USD) falls to near $33.15 during the early European session on Thursday, pressured by some profit-taking. Nonetheless, the downside for the white metal might be limited as US President Donald Trump announced sweeping new global tariffs on Wednesday, raising the fears of a widening trade war.
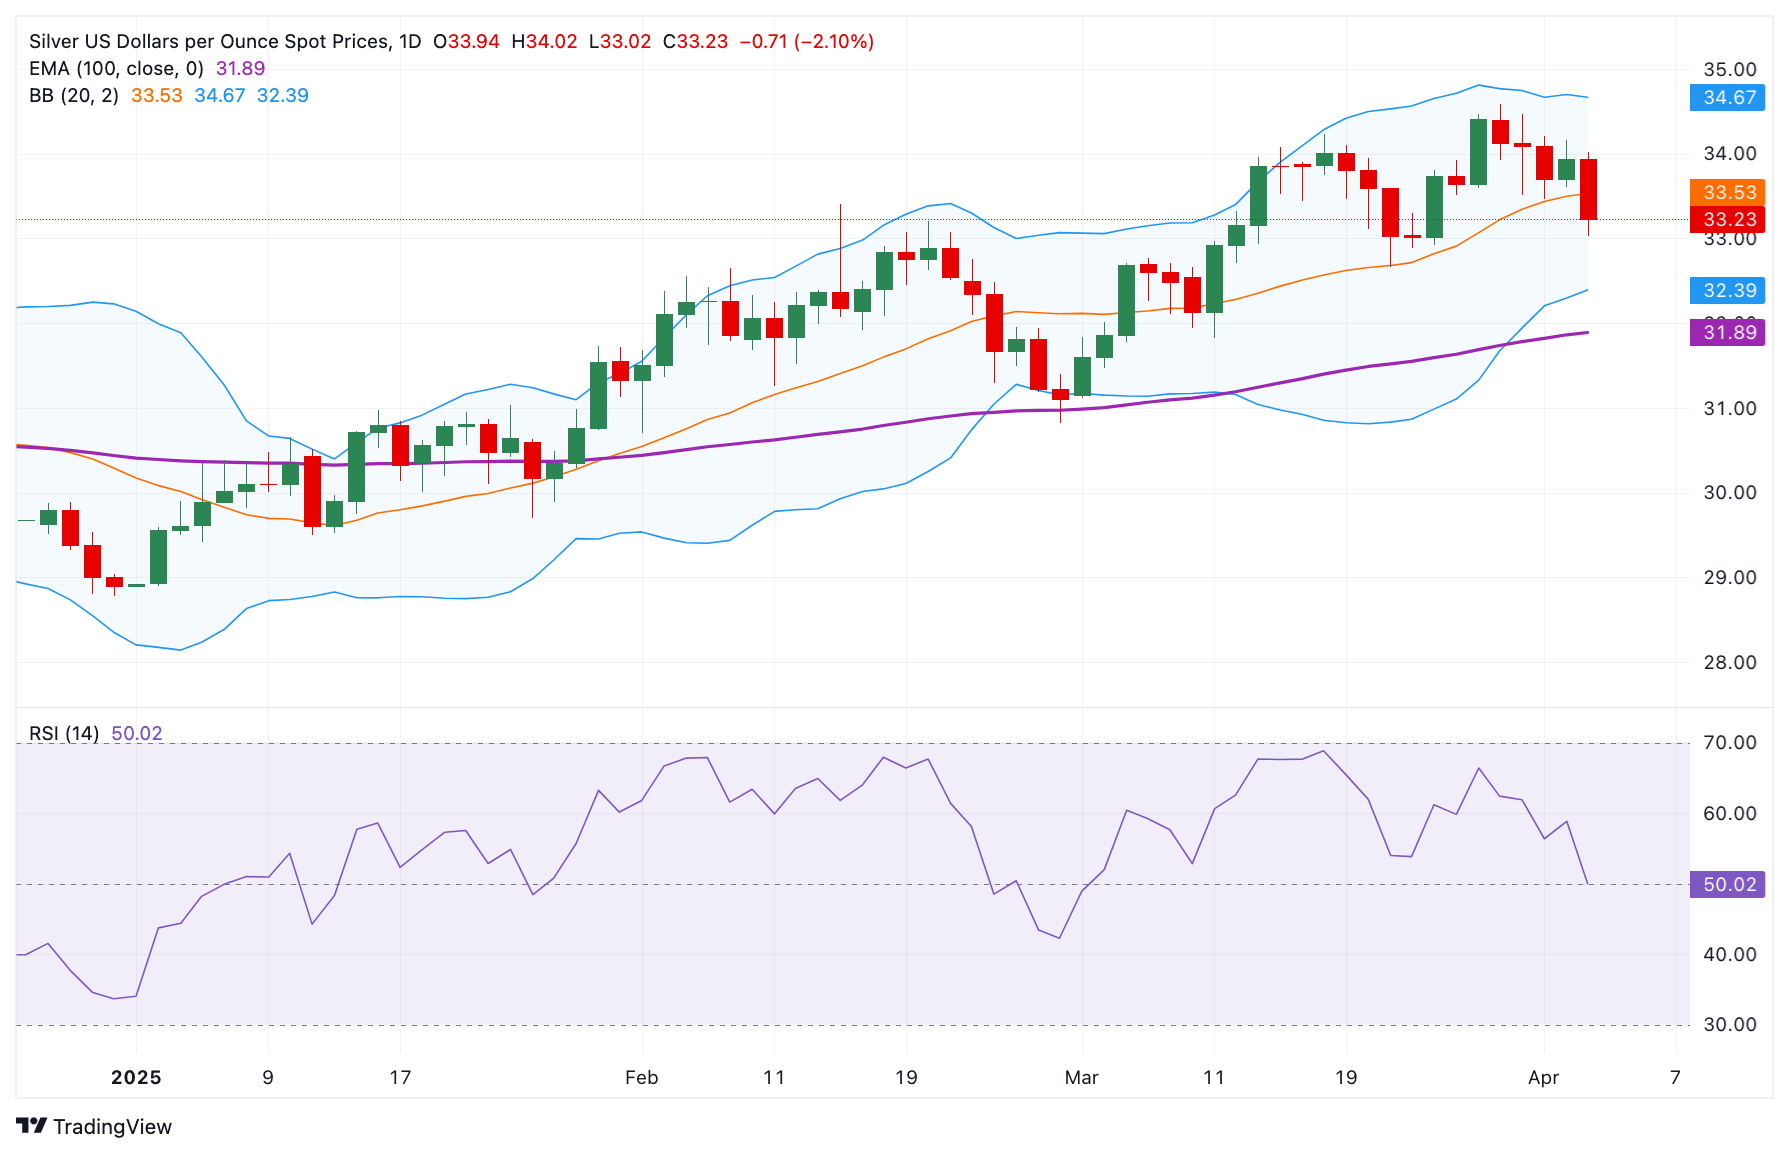
According to the daily chart, the bullish trend of Silver remains in place as the commodity is well-supported above the key 100-day Exponential Moving Average (EMA). However, the 14-day Relative Strength Index (RSI) hovers around the midline, displaying neutral momentum in the near term. This suggests that further consolidation cannot be ruled out.
The immediate resistance level for white metal emerges at $34.23, the high of March 18. Further north, the next hurdle to watch is the $34.60-$34.70 zone, representing the high of March 28 and the upper boundary of the Bollinger Band. A decisive break above the mentioned level could pave the way to the $35.00 psychological level.
On the flip side, the first downside target for the silver price is seen at $32.66, the low of March 21. Sustained trading below the mentioned level could see a drop to the next contention level at $31.89, the 100-day EMA. Any follow-through selling could expose $30.82, the low of February 28.
Silver price (XAG/USD) daily chart
Silver FAQs
Silver is a precious metal highly traded among investors. It has been historically used as a store of value and a medium of exchange. Although less popular than Gold, traders may turn to Silver to diversify their investment portfolio, for its intrinsic value or as a potential hedge during high-inflation periods. Investors can buy physical Silver, in coins or in bars, or trade it through vehicles such as Exchange Traded Funds, which track its price on international markets.
Silver prices can move due to a wide range of factors. Geopolitical instability or fears of a deep recession can make Silver price escalate due to its safe-haven status, although to a lesser extent than Gold's. As a yieldless asset, Silver tends to rise with lower interest rates. Its moves also depend on how the US Dollar (USD) behaves as the asset is priced in dollars (XAG/USD). A strong Dollar tends to keep the price of Silver at bay, whereas a weaker Dollar is likely to propel prices up. Other factors such as investment demand, mining supply – Silver is much more abundant than Gold – and recycling rates can also affect prices.
Silver is widely used in industry, particularly in sectors such as electronics or solar energy, as it has one of the highest electric conductivity of all metals – more than Copper and Gold. A surge in demand can increase prices, while a decline tends to lower them. Dynamics in the US, Chinese and Indian economies can also contribute to price swings: for the US and particularly China, their big industrial sectors use Silver in various processes; in India, consumers’ demand for the precious metal for jewellery also plays a key role in setting prices.
Silver prices tend to follow Gold's moves. When Gold prices rise, Silver typically follows suit, as their status as safe-haven assets is similar. The Gold/Silver ratio, which shows the number of ounces of Silver needed to equal the value of one ounce of Gold, may help to determine the relative valuation between both metals. Some investors may consider a high ratio as an indicator that Silver is undervalued, or Gold is overvalued. On the contrary, a low ratio might suggest that Gold is undervalued relative to Silver.
Recommended Articles


