

Natural Gas prices rise for second consecutive day
- Natural Gas prices are up nearly 1% on Tuesday.
- Traders focus on summer supply for restocking ahead of the next heating season.
- The US Dollar Index consolidates below 104.00 ahead of a chunky calendar.
Natural Gas (XNG/USD) is holding ground above $1.70 after the steep decline seen on Friday. Traders appear to be defining a higher floor for prices after reaching a multi-year low near $1.60 a week ago. With demand heating up for contracts and deliveries over the summer, both Russia and the US are trying to steal the market share from one another while demand remains tepid.
The US Dollar (USD) is facing a slight blow, with a basket of currencies all advancing against the Greenback. The charge is being led by the Japanese Yen, which is up near 0.50% against the US Dollar. US Traders are bracing for Durable Goods numbers and some confidence indicators later in the US session to be released.
Natural Gas is trading at $1.79 per MMBtu at the time of writing.
Natural Gas market movers: More LNG supply needed
- Bloomberg has issued a Natural Gas supply report where it calculated markets will need 1.8% more volume over the summer to meet demand growth compared with a year earlier..
- Several European trading desks report that Asian buyers are coming into the European markets to buy at low prices, creating further upward pressure on European gas prices.
- BP has appointed its top LNG executive James Cheeseman to lead the Ammonia trading business as demand for more green energy pairs with conventional energy sources like Gas and Oil.
- Russia and the US are fighting for the biggest piece of market share in the gas market. Russian supply is at risk of more sanctions and bottlenecks, while the US trying to guarantee a stable and secured supply. Australia is further falling behind in market share as output declines due to ageing fields.
Natural Gas Technical Analysis: Piece of the pie
Natural Gas is set to test the bar again near $1.80 as traders see a floor on the charts. The expected recovery comes, firstly, because there are prospects of a pickup in demand during the summer. Secondly, the fight between Russia and the US on market share will likely come with a price war. However,Gas traders might be willing to pay a higher price for US Gas, whose delivery is likely to be more secure compared to the cheaper Russian Gas, more subject to sanctionsand bottlenecks.
On the upside, Natural Gas is facing some pivotal technical levels to get back to. The next step is $1.99, – the level which, when broken, saw an accelerated decline. After that, the green line at $2.13 comes into view, with the triple bottoms from 2023. If Natural Gas sees sudden demand pick up, $2.40 could come into play.
On the downside, $1.64 and $1.53 (the low of 2020) are targets to look out for. Another leg lower could come if global growth starts to shrink and there is less demand. Add to that equation both the US and Canada trying to free up more volume of Natural Gas mining, and the scale could quickly tip into an oversupplied market with more downside prices at hand.
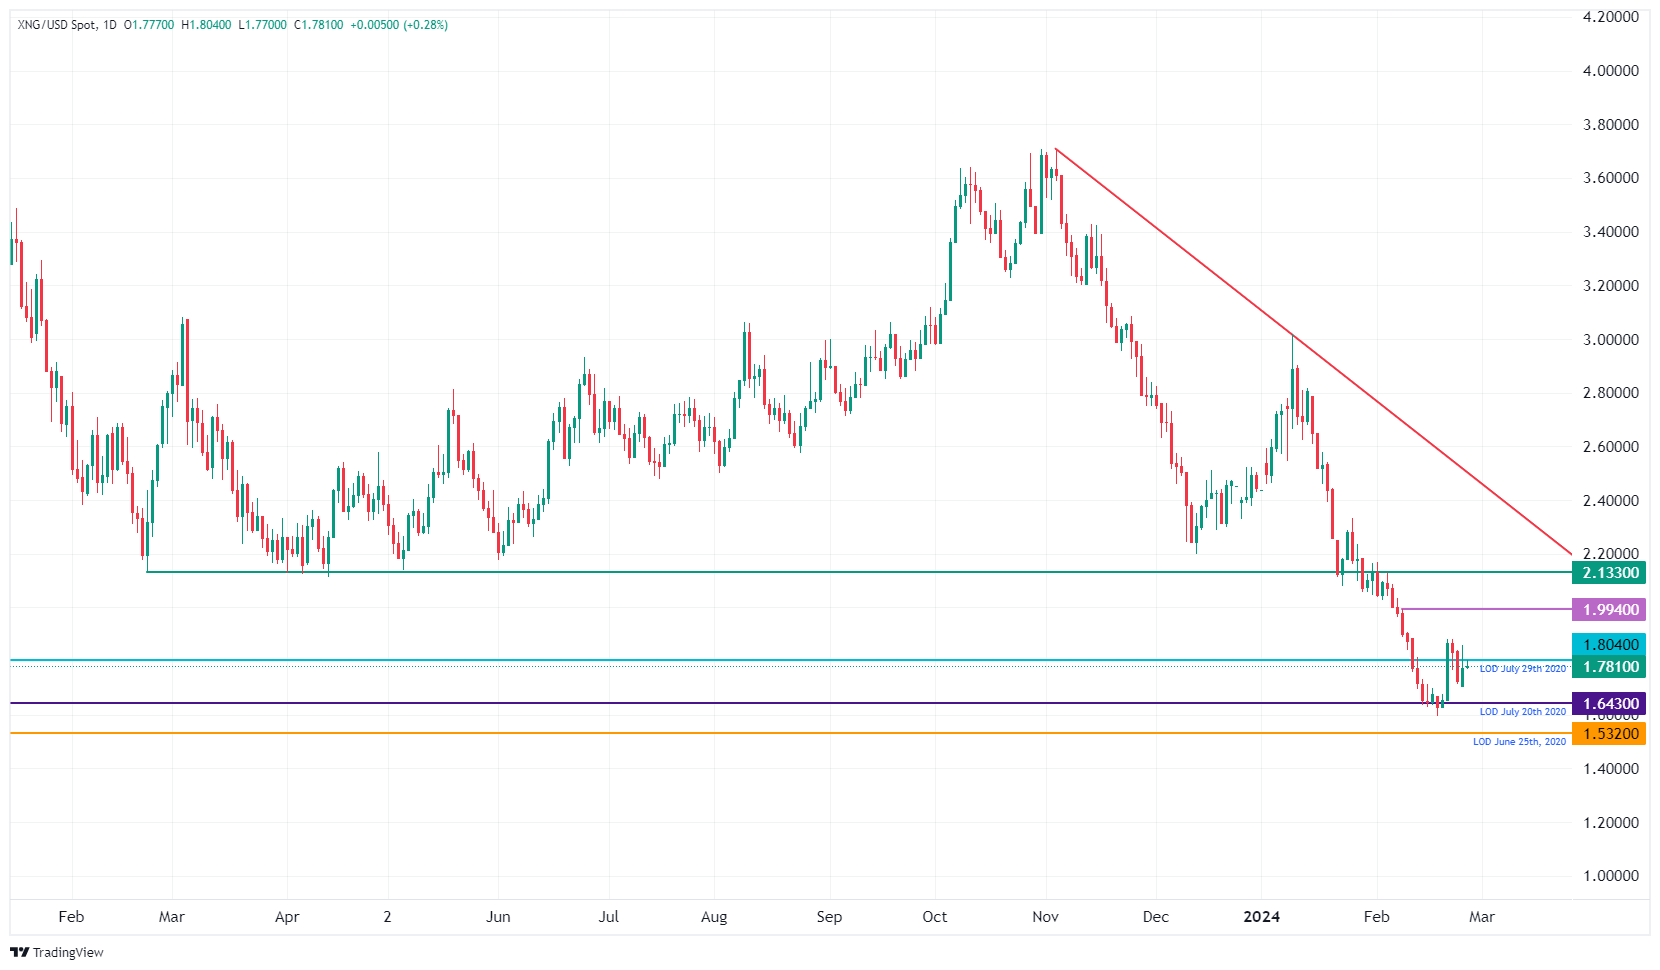
XNG/USD (Daily Chart)
Natural Gas FAQs
What fundamental factors drive the price of Natural Gas?
Supply and demand dynamics are a key factor influencing Natural Gas prices, and are themselves influenced by global economic growth, industrial activity, population growth, production levels, and inventories. The weather impacts Natural Gas prices because more Gas is used during cold winters and hot summers for heating and cooling. Competition from other energy sources impacts prices as consumers may switch to cheaper sources. Geopolitical events are factors as exemplified by the war in Ukraine. Government policies relating to extraction, transportation, and environmental issues also impact prices.
What are the main macroeconomic releases that impact on Natural Gas Prices?
The main economic release influencing Natural Gas prices is the weekly inventory bulletin from the Energy Information Administration (EIA), a US government agency that produces US gas market data. The EIA Gas bulletin usually comes out on Thursday at 14:30 GMT, a day after the EIA publishes its weekly Oil bulletin. Economic data from large consumers of Natural Gas can impact supply and demand, the largest of which include China, Germany and Japan. Natural Gas is primarily priced and traded in US Dollars, thus economic releases impacting the US Dollar are also factors.
How does the US Dollar influence Natural Gas prices?
The US Dollar is the world’s reserve currency and most commodities, including Natural Gas are priced and traded on international markets in US Dollars. As such, the value of the US Dollar is a factor in the price of Natural Gas, because if the Dollar strengthens it means less Dollars are required to buy the same volume of Gas (the price falls), and vice versa if USD strengthens.
Recommended Articles


