

WTI Oil retreats towards $77 as Iraq reopens refinery, adding to market supply
- WTI Oil hits a ceiling above $78 and is unable to break higher.
- Oil traders are sending crude lower under some profit-taking and comments on OPEC+ production cuts.
- The US Dollar Index is giving up on 104.00 as risk-on sentiment weighs on the Greenback.
Oil prices are sliding nearly 1% on Friday as Iraq announced the reopening of a refinery that was closed for a decade and amid expectations that OPEC+ countries won’t opt for big production cuts. President Of Rapidan Energy and former White House official Bob McNally said that OPEC+ said on Bloomberg that the group of Oil-producing countries will likely need to extend its voluntary production cuts beyond the first quarter of the year, but that any further big cuts in supply aren’t expected.
Meanwhile, the US Dollar Index (DXY) is retreating for the week, consolidating its losses. The Greenback is losing ground as equities are having a field day, with several indexes trading at fresh all-time highs. Traders look to next week, when nearly every day features a big market-moving data point which has the potential to move the needle for the DXY US Dollar Index.
Crude Oil (WTI) trades at $77.43 per barrel, and Brent Oil trades at $81.81 per barrel at the time of writing.
Oil news and market movers: OPEC production cuts are no surprises
- Iraqi Prime Minister Mohammed Shia’ Al Sudani has announced the reopening of a refinery in Baiji.
- OPEC+ will lengthen, though not broaden, its voluntary production cuts, President of Rapidan EnergyBob McNally said on a Bloomberg interview.
- Oil traders are not pricing in any further geopolitical risk from the Middle East.
- The London Energy Forum 2024 Summit will take place on Monday and Tuesday next week, an event that usually brings market-moving headlines from big industry leaders. That will be followed by the International Energy Week from Tuesday to Friday.
- The Energy Information Administration (EIA) saw another build in US Crude stockpile changes from already a previous build of 12.018 million barrels with an additional 3.514 million barrels for this week.
- Traders will be on the lookout for any replications of the fresh sanctions packages from the US and the EU for Oil towards Russia and other parties in countries accused of trading Russian Oil.
- The weekly Baker Hughes Oil Rig Count is to be released at 18:00 GMT. The previous number stood at 497.
Oil Technical Analysis: This is it thus far
Oil prices have been trying to push higher to $80, with traders bracing for the US and EU sanction package due to be released on Friday. Sanctions are not only against Russia but also against some Chinese and Indian parties who are allegedly aiding Russia. Despite the technical breakout, Oil has not been able to run away higher, so a return to $90 or even $85 looks bleak for now.
Still acting as the line in the sand is $80, with $79.66 as the first level to have a look at on the upside. Should the Relative Strength Index (RSI) not head into overbought territory too quickly, look for $84.58 and $89.64 as next targets to the upside. The ultimate target in this area would be $92.69, with the tops from November 2022 coming into play.
On the downside, support from the 55-day SMA at $74.20 should work before the green ascending trend line near $72.93 gets tested. If that trend line snaps, look for the purple line near $67.11 to catch any falling knives. Seeing the triple bottom from June andJuly 2023, that level should be strong enough to support.
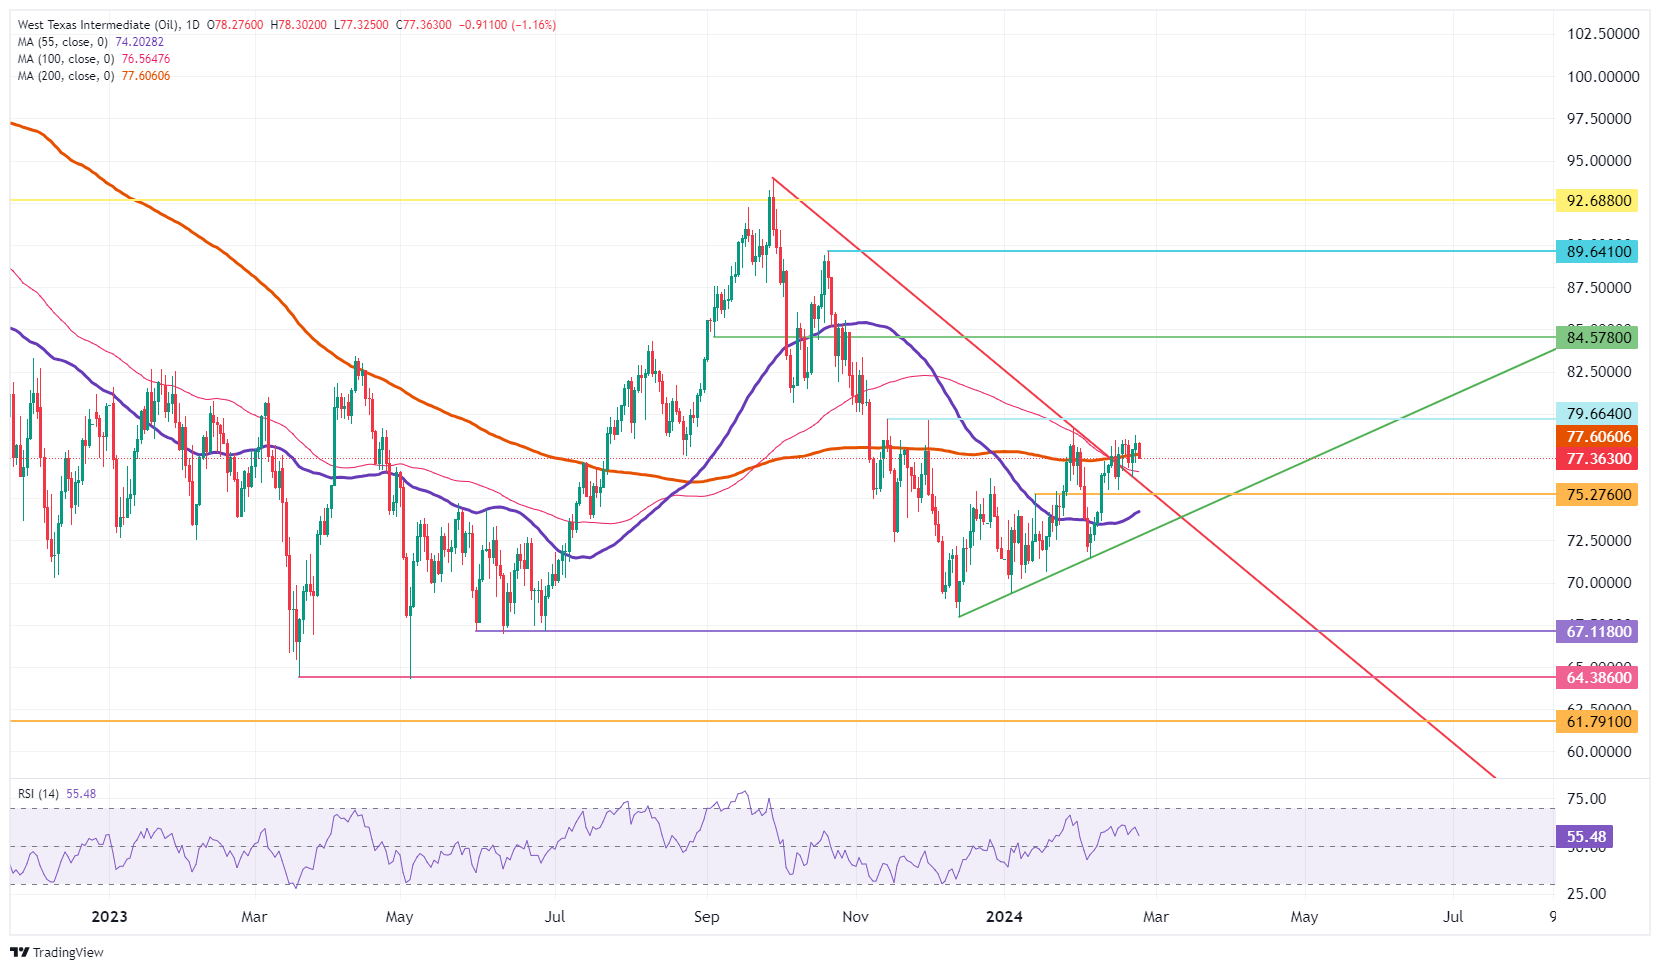
US WTI Crude Oil: Daily Chart
WTI Oil FAQs
What is WTI Oil?
WTI Oil is a type of Crude Oil sold on international markets. The WTI stands for West Texas Intermediate, one of three major types including Brent and Dubai Crude. WTI is also referred to as “light” and “sweet” because of its relatively low gravity and sulfur content respectively. It is considered a high quality Oil that is easily refined. It is sourced in the United States and distributed via the Cushing hub, which is considered “The Pipeline Crossroads of the World”. It is a benchmark for the Oil market and WTI price is frequently quoted in the media.
What factors drive the price of WTI Oil?
Like all assets, supply and demand are the key drivers of WTI Oil price. As such, global growth can be a driver of increased demand and vice versa for weak global growth. Political instability, wars, and sanctions can disrupt supply and impact prices. The decisions of OPEC, a group of major Oil-producing countries, is another key driver of price. The value of the US Dollar influences the price of WTI Crude Oil, since Oil is predominantly traded in US Dollars, thus a weaker US Dollar can make Oil more affordable and vice versa.
How does inventory data impact the price of WTI Oil
The weekly Oil inventory reports published by the American Petroleum Institute (API) and the Energy Information Agency (EIA) impact the price of WTI Oil. Changes in inventories reflect fluctuating supply and demand. If the data shows a drop in inventories it can indicate increased demand, pushing up Oil price. Higher inventories can reflect increased supply, pushing down prices. API’s report is published every Tuesday and EIA’s the day after. Their results are usually similar, falling within 1% of each other 75% of the time. The EIA data is considered more reliable, since it is a government agency.
How does OPEC influence the price of WTI Oil?
OPEC (Organization of the Petroleum Exporting Countries) is a group of 13 Oil-producing nations who collectively decide production quotas for member countries at twice-yearly meetings. Their decisions often impact WTI Oil prices. When OPEC decides to lower quotas, it can tighten supply, pushing up Oil prices. When OPEC increases production, it has the opposite effect. OPEC+ refers to an expanded group that includes ten extra non-OPEC members, the most notable of which is Russia.
Recommended Articles


