

Crude Oil rises on Wednesday as energies shrug off another inventories surge
- WTI climbed back towards $78.00 per barrel on Wednesday.
- API US barrel counts lurched higher once more.
- Geopolitical concerns and hopes of refinery expansion keep barrel bids high.
West Texas Intermediate (WTI) US Crude Oil rebounded on Wednesday as barrel traders continue to price in possible supply lane constraints amidst geopolitical turmoil in the Middle East. Hopes of expanded US refinery activity eating away at a buildup of US Crude Oil supplies are also keeping barrel prices higher, but a growing overhang of US barrel counts is getting harder for energy markets to ignore.
According to the American Petroleum Insitute (API), US Crude Oil supply stocks unexpectedly rose once again for the week ended February 16, with an additional 7.168 million barrels added to US supply. This comes well above the forecast 4.298 million barrels and adds even further to the previous week’s surprise glut of 8.52 million barrels.
According to API barrel counts, US Crude Oil supplies are up an excess of nearly 18 million barrels since the week ended November 2.
US Crude Oil refineries have been slowly coming back online since overall refined petroleum product output declined in 2022 as several refineries went offline for overhauls, upgrades, or security concerns. Barrel traders are betting on an uptick in US refining capacity to eat away at record Crude Oil production within the US and other countries that are not part of the Organization of the Petroleum Exporting Countries (OPEC).
WTI technical outlook
WTI US Crude Oil climbed over 2% bottom-to-top from Wednesday’s low bids near $76.25, and WTI is climbing towards $78.00 per barrel as energy markets pin back into near-term highs.
Daily candlesticks show US Crude Oil in a notably sideways bent as bids knock into the 200-day Simple Moving Average (SMA) near $77.55. WTI has failed to pierce into fresh high ground since peaking at $79.20 in January, and Crude Oil longs are struggling to drag WTI further into bull country after barrel prices bottomed out in December at $67.97.
WTI peaked just shy of $94.00 per barrel last September, and remains down over 17% from that high.
WTI hourly chart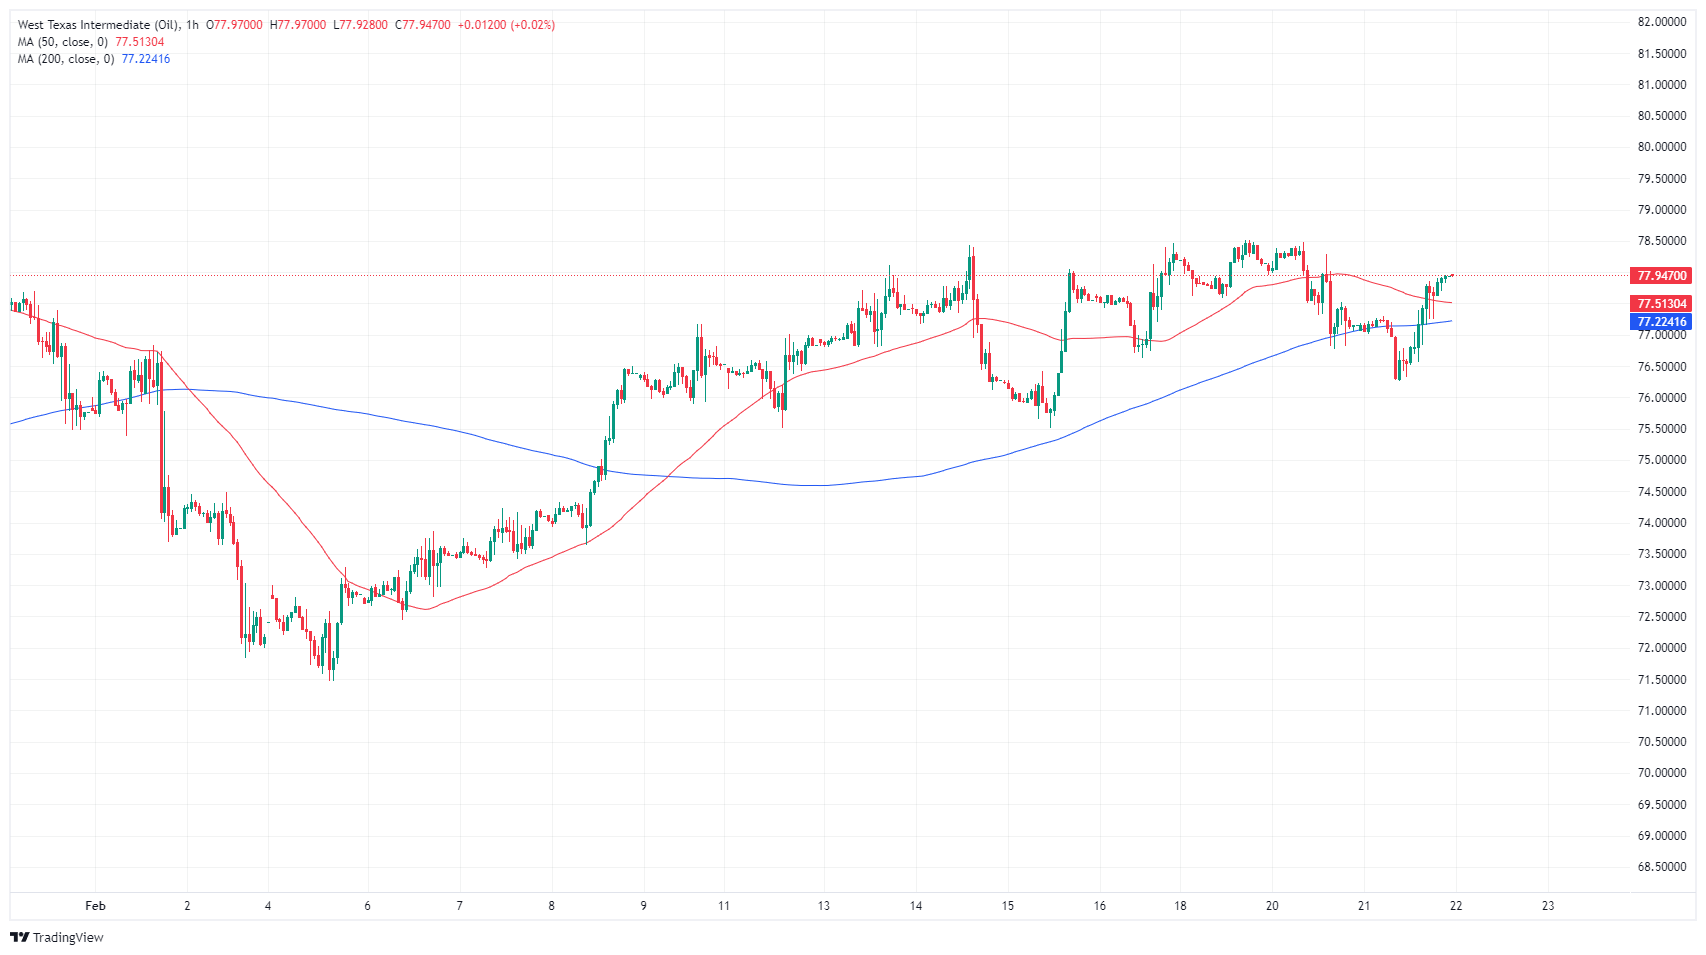
WTI daily chart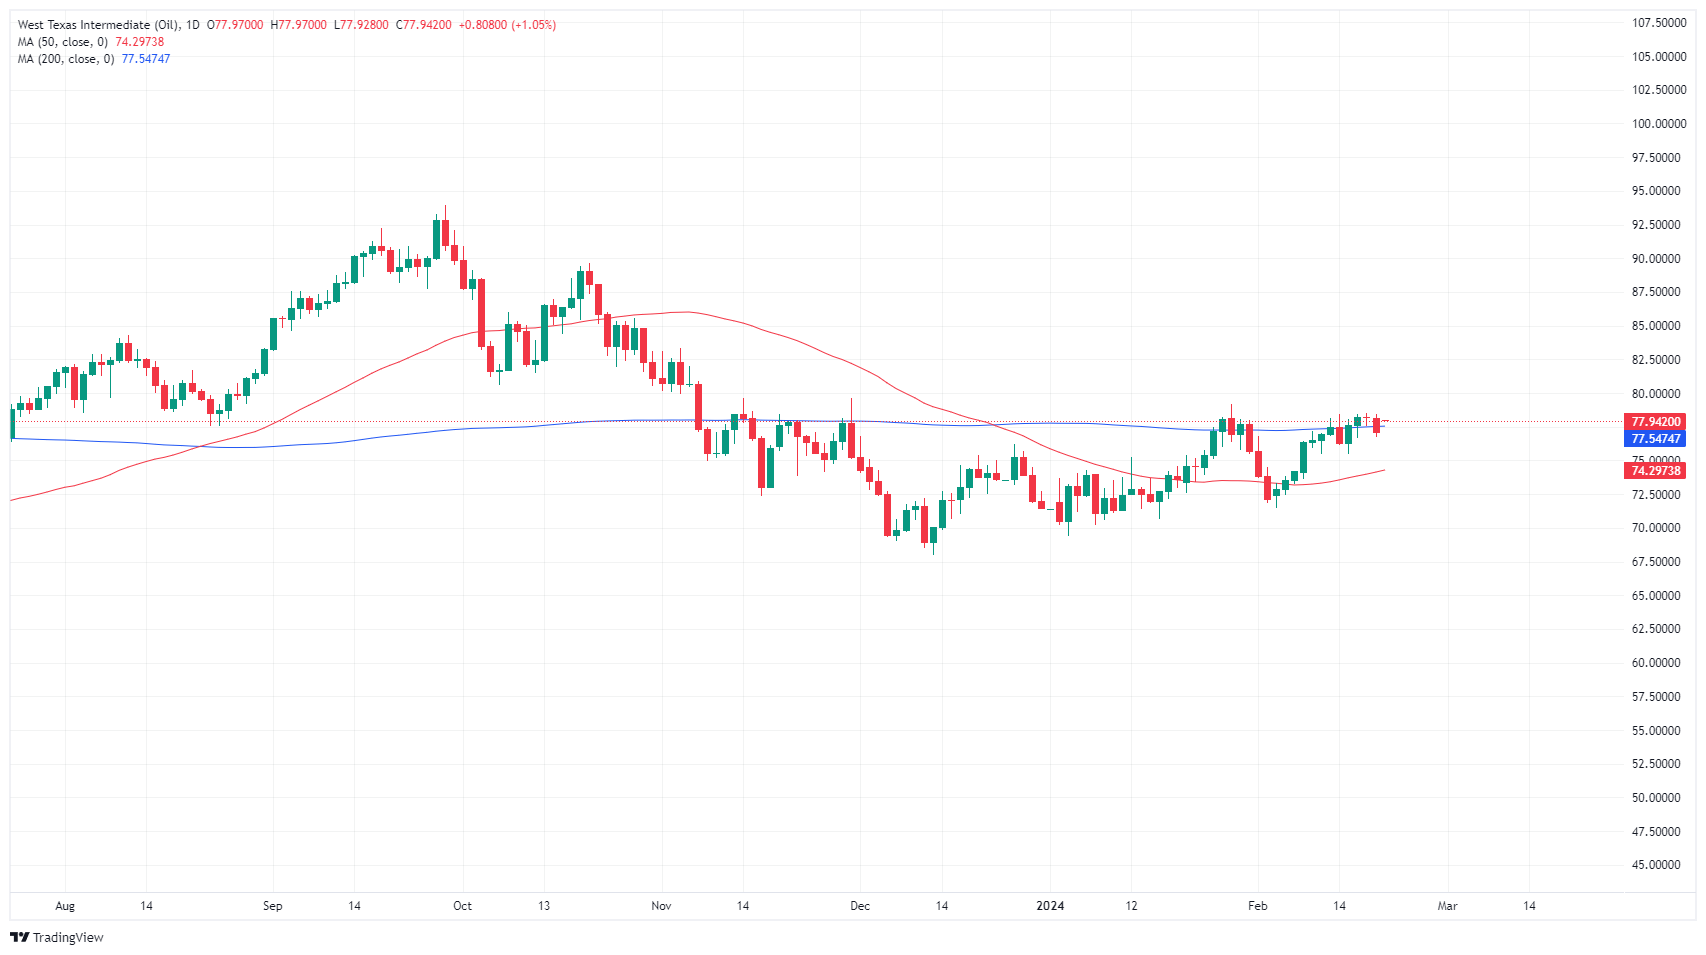
Recommended Articles


