

Silver Price Forecast: XAG/USD holds onto gains above $23 ahead of FOMC minutes

Source Fxstreet
  • Silver price clings to gains ahead of Fed minutes.
  • The confidence of Fed policymakers that inflation is in the right direction has dampened the USD Index’s appeal.
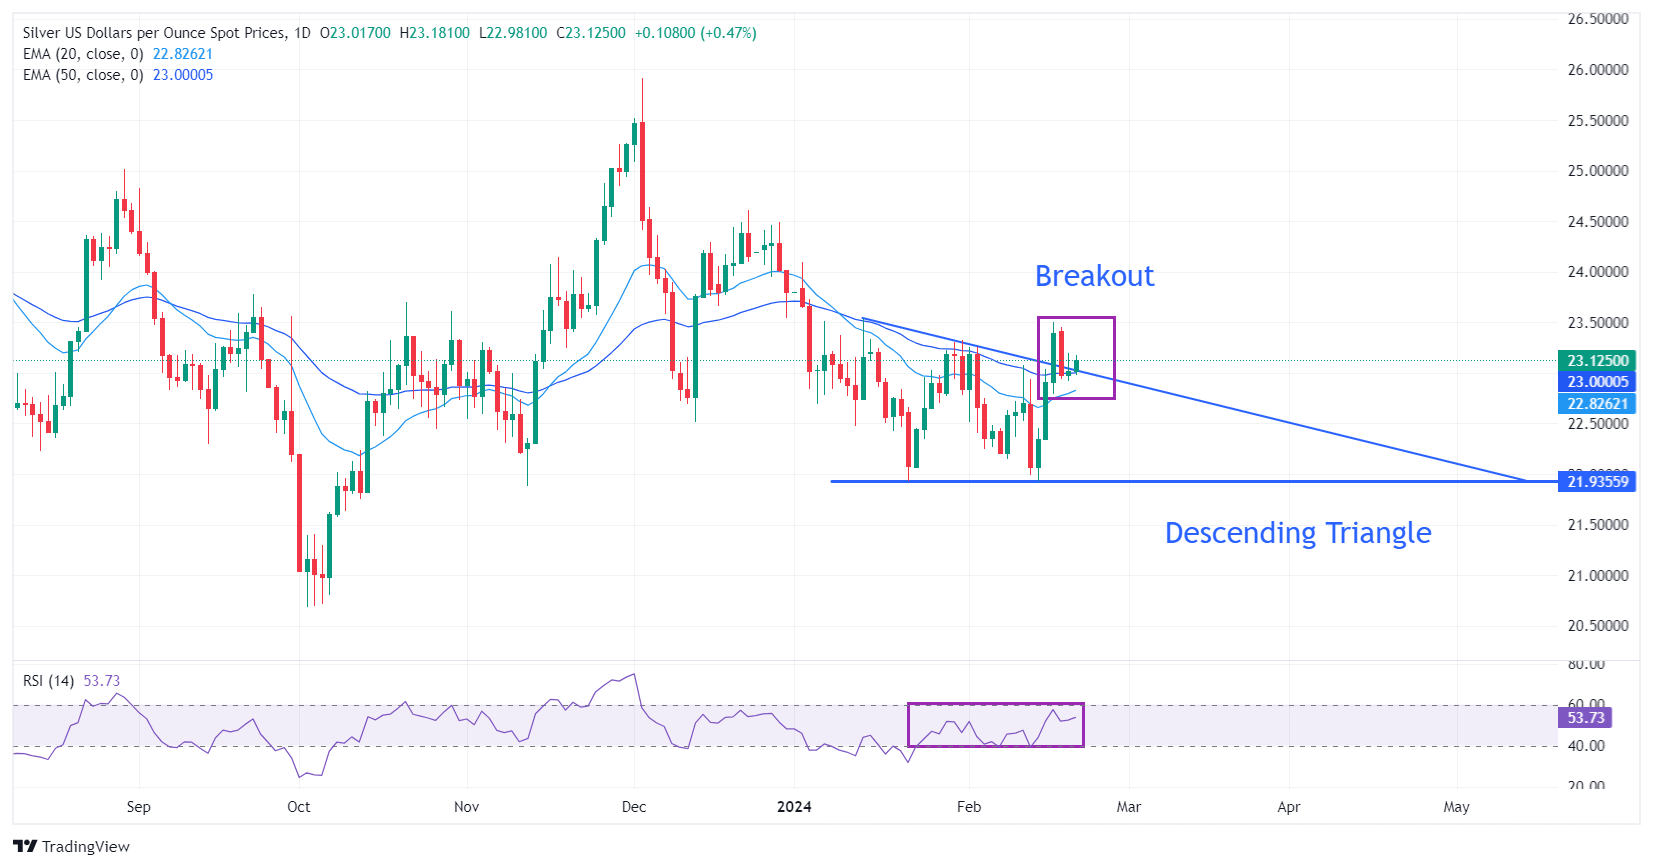
  • Silver price is expected to deliver stellar gains amid a Descending Triangle breakout.

Silver price (XAU/USD) turns sideways around $23.15 after a strong recovery in the European session on Wednesday. The white metal clings to solid gains as the US Dollar has shifted to the backfoot AS Federal Reserve (Fed) policymakers are confident that the secular inflationary trend is in the right direction despite a one-time rise in price pressures in January

Mixed action is being observed in risk-perceived assets ahead of the release of the Federal Open Market Committee (FOMC) minutes. While S&P500 futures are under pressure, risk-sensitive currencies have been underpinned against the US Dollar. The US Dollar Index (DXY), which gauges the Greenback’s value against six rival currencies, is slightly above the weekly low of around 103.80.

The FOMC minutes will provide more guidance on interest rates and an in-depth explanation behind the Fed maintaining interest rates unchanged in the range of 5.25%-5.50% for the fourth time in a row.

This week, investors will focus on the preliminary S&P Global Manufacturing and Services PMI for February, which will be published on Thursday. The Manufacturing PMI is forecasted to decrease to 50.5 from 50.7 in January. The Services PMI that represents the service sector, which accounts for two-thirds of the United States economy, is expected to release at 52.0, lower than the prior reading of 52.5.

Silver technical analysis

Silver price rebounds after testing the breakout region of the Descending Triangle chart pattern formed on a daily timeframe near $23.00. The near-term outlook for the white metal has turned bullish as it has comfortably settled above the 20 and 50-day Exponential Moving Averages (EMAs), which trade around $22.80 and $23.00, respectively.

The 14-period Relative Strength Index (RSI) approaches the 60.00 hurdle. A decisive break above the same would trigger a bullish momentum.

Silver daily chart
 

Disclaimer: For information purposes only. Past performance is not indicative of future results.
placeholder
WTI (USOIL) Is down 2.03% on Sep 25: Here Is WhyWTI (USOIL) is down 2.03% at Sep 24 22:20(UTC+0), now at $92.517, with a 7-day down of 3.63%.What is driving WTI (USOIL)’s stock price down today?The drop in WTI crude oil prices was primarily driven by
Author  TradingKey
17 hours ago
WTI (USOIL) is down 2.03% at Sep 24 22:20(UTC+0), now at $92.517, with a 7-day down of 3.63%.What is driving WTI (USOIL)’s stock price down today?The drop in WTI crude oil prices was primarily driven by
placeholder
Silver Price Forecast: XAG/USD remains steady near $64.00 as oil prices easeSilver price (XAG/USD) inches higher after two days of losses, trading around $63.90 per troy ounce during Asian hours on Friday. Non-yielding Silver is finding underlying support as inflation concerns ease following a pullback in crude oil prices.
Author  FXStreet
19 hours ago
Silver price (XAG/USD) inches higher after two days of losses, trading around $63.90 per troy ounce during Asian hours on Friday. Non-yielding Silver is finding underlying support as inflation concerns ease following a pullback in crude oil prices.
placeholder
Gold Price Forecast: Gold Drops Below $4,300, Will It Continue to Fall? As of the European session on September 24, gold prices (XAUUSD) extended their correction, dipping below $4,300 intraday to hit a low of $4,262.45. After previously rebounding close to $
Author  TradingKey
Yesterday 09: 57
As of the European session on September 24, gold prices (XAUUSD) extended their correction, dipping below $4,300 intraday to hit a low of $4,262.45. After previously rebounding close to $
placeholder
Yen touches 158.37 as Tokyo reopens, then slips back — ¥15.4 trillion of intervention and the 200-day line stand between here and 160USD/JPY reached 158.37 overnight, its highest since early September, then eased to 157.88 as Japanese markets reopened after a three-day holiday. The Ministry of Finance has spent ¥15.4 trillion defending the yen since late July and the BOJ ran a rate check on September 18. The 200-day average sits at 158.43.
Author  Irene Q.
Yesterday 06: 59
USD/JPY reached 158.37 overnight, its highest since early September, then eased to 157.88 as Japanese markets reopened after a three-day holiday. The Ministry of Finance has spent ¥15.4 trillion defending the yen since late July and the BOJ ran a rate check on September 18. The 200-day average sits at 158.43.
placeholder
US input costs rose at the fastest pace in four years — the September flash PMI beat is an inflation story, not a growth storyUS September flash PMIs came in far above expectations, with the composite at 58.4, a five-year high. But the detail that moved markets was input cost inflation at its fastest since October 2022, driven by fuel, transport and supply shortages. Brent is back above $100 and the 10-year Treasury yield has hit its highest since 2007.
Author  Suzie
Yesterday 06: 46
US September flash PMIs came in far above expectations, with the composite at 58.4, a five-year high. But the detail that moved markets was input cost inflation at its fastest since October 2022, driven by fuel, transport and supply shortages. Brent is back above $100 and the 10-year Treasury yield has hit its highest since 2007.
goTop
quote