


Silver Price Forecast: XAG/USD rebounds strongly to near $32.50 as Fed guides steady policy stance
- Silver price remains higher despite multiple headwinds.
- Fed officials have guided that interest rates should remain in the current range for now.
- Trump’s tariff fears have eased and hopes for Russia-Ukraine peace have increased.
Silver price (XAG/USD) bounces back strongly to near $32.50 in Tuesday’s European session. The white metal recovers its intraday losses and turns positive despite multiple headwinds, such as firm expectations for the Federal Reserve’s (Fed) ‘higher for longer’ interest rate stance, growing optimism over Russia-Ukraine peace, and easing United States (US) President Donald Trump’s tariff fears.
On Monday, a slew of Fed officials stated that current monetary policy conditions are in great shape, given resilient US economic growth, still-elevated inflationary pressures, and a balanced labor market. Fed Governor Michelle Bowman said she would like to gain “greater confidence” that progress in lowering inflation will “continue” before considering any monetary policy adjustment.
Technically, increasing hopes that the Fed will keep interest rates steady for longer bode poorly for precious metals, such as Silver.
Meanwhile, growing optimism about peace between Russia and Ukraine is expected to keep a lid on Silver’s upside. Last week, Donald Trump confirmed that both leaders of Russia and Ukraine have agreed to peace negotiations and ordered his team to begin truce talks.
Historically, the scenario of improving geopolitical tensions diminishes the appeal of precious metals, such as Silver.
Over that, investors expect Trump’s reciprocal tariffs won’t be as fearful as previously anticipated. Trump didn’t reveal a detailed reciprocal tariff plan on Thursday, while he was expected to do so. The tariff plan is unlikely to come into effect before April as Trump nominated Commerce Secretary Howard Lutnick said on Thursday that the President will be ready to move on reciprocal tariffs by April 1.
Market participants expect US trading partners would have enough time to negotiate with Trump on reciprocity.
Silver technical analysis
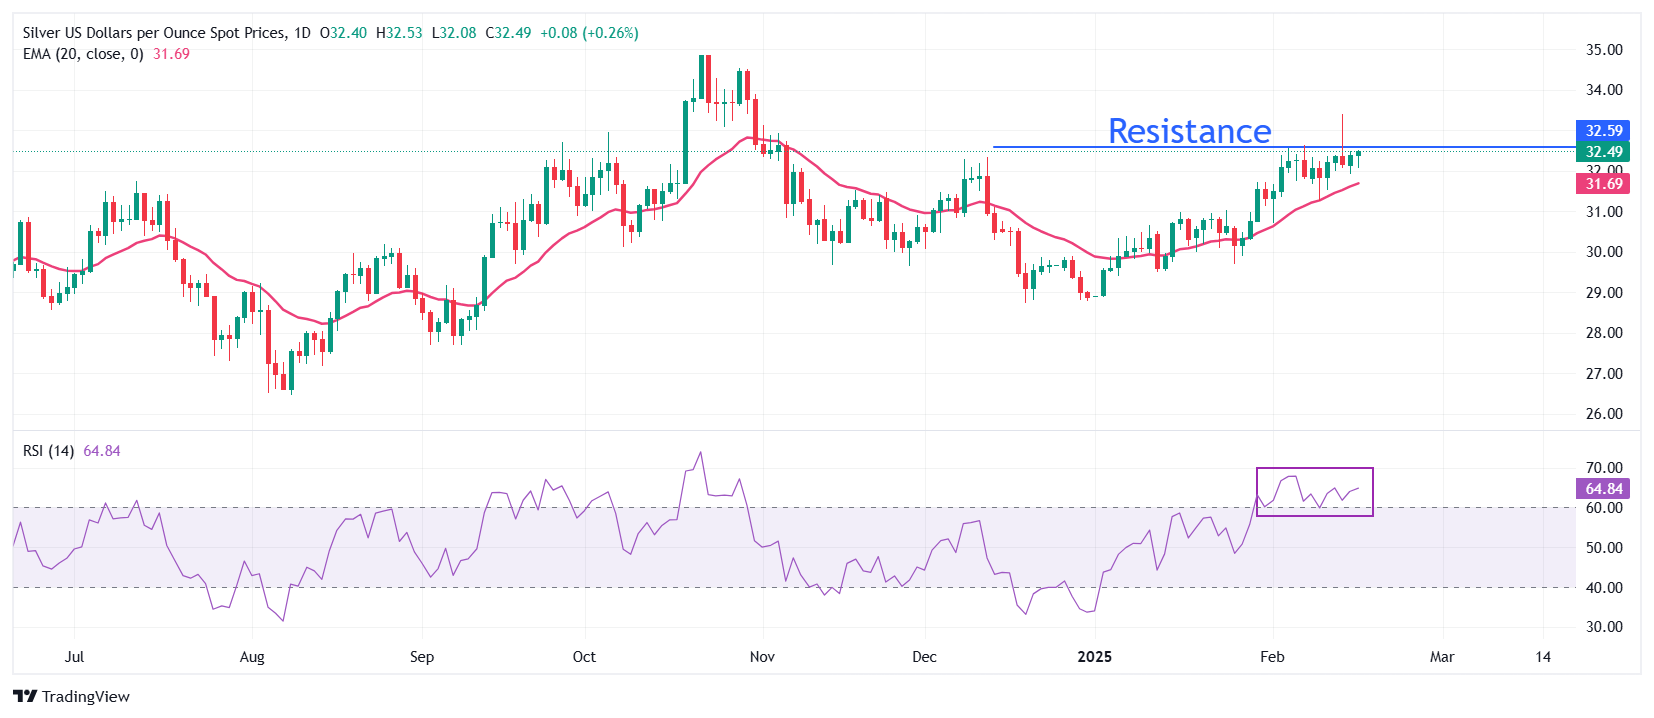
Silver price struggles to break above the key resistance of $32.55, which is plotted from the February 5 high. The outlook of the white metal was already bullish as the 20-day Exponential Moving Average (EMA) has been sloping higher, which trades around $31.70.
The 14-day Relative Strength Index (RSI) oscillates in the 60.00-80.00 range, suggesting that the momentum is strongly bullish.
Looking down, the February 11 low of $31.26 will be the key support for the Silver price. While, the October 31 high of $33.90 will be the key barrier.
Silver daily chart
Silver FAQs
Silver is a precious metal highly traded among investors. It has been historically used as a store of value and a medium of exchange. Although less popular than Gold, traders may turn to Silver to diversify their investment portfolio, for its intrinsic value or as a potential hedge during high-inflation periods. Investors can buy physical Silver, in coins or in bars, or trade it through vehicles such as Exchange Traded Funds, which track its price on international markets.
Silver prices can move due to a wide range of factors. Geopolitical instability or fears of a deep recession can make Silver price escalate due to its safe-haven status, although to a lesser extent than Gold's. As a yieldless asset, Silver tends to rise with lower interest rates. Its moves also depend on how the US Dollar (USD) behaves as the asset is priced in dollars (XAG/USD). A strong Dollar tends to keep the price of Silver at bay, whereas a weaker Dollar is likely to propel prices up. Other factors such as investment demand, mining supply – Silver is much more abundant than Gold – and recycling rates can also affect prices.
Silver is widely used in industry, particularly in sectors such as electronics or solar energy, as it has one of the highest electric conductivity of all metals – more than Copper and Gold. A surge in demand can increase prices, while a decline tends to lower them. Dynamics in the US, Chinese and Indian economies can also contribute to price swings: for the US and particularly China, their big industrial sectors use Silver in various processes; in India, consumers’ demand for the precious metal for jewellery also plays a key role in setting prices.
Silver prices tend to follow Gold's moves. When Gold prices rise, Silver typically follows suit, as their status as safe-haven assets is similar. The Gold/Silver ratio, which shows the number of ounces of Silver needed to equal the value of one ounce of Gold, may help to determine the relative valuation between both metals. Some investors may consider a high ratio as an indicator that Silver is undervalued, or Gold is overvalued. On the contrary, a low ratio might suggest that Gold is undervalued relative to Silver.
Recommended Articles


