

Crude Oil rebounds on Monday, WTI climbs back over $71

Source Fxstreet
  • Crude Oil markets recovered lost ground on Monday, rising 0.8%.
  • WTI bounced back above $71.00 per barrel but still remains soft.
  • US drilling activity remains low, but demand remains soft.

West Texas Intermediate (WTI) US Crude Oil prices rebounded on Monday despite an overall lack of news during the US session. US markets were largely dark in celebration of President’s Day, keeping trade volumes in check.

Trade sanctions are keeping some shipping vessels moored offshore in Russia, crimping energy flows in the Asiatic regions. Global Crude Oil demand is also consistently underperforming forecasts, sparking some pumping agencies to slow up their production metrics. Despite turning the spigots lower, US production continues to outrun refiners’ ability to sop up production, which hit its tenth-highest ever week-on-week output capacity according to the Energy Information Administration (EIA).

The latest week-on-week Crude Oil supplies figures for the US are due from the EIA as well as the American Petroleum Institute (API). Both figures are slated for release on Wednesday.

WTI price forecast

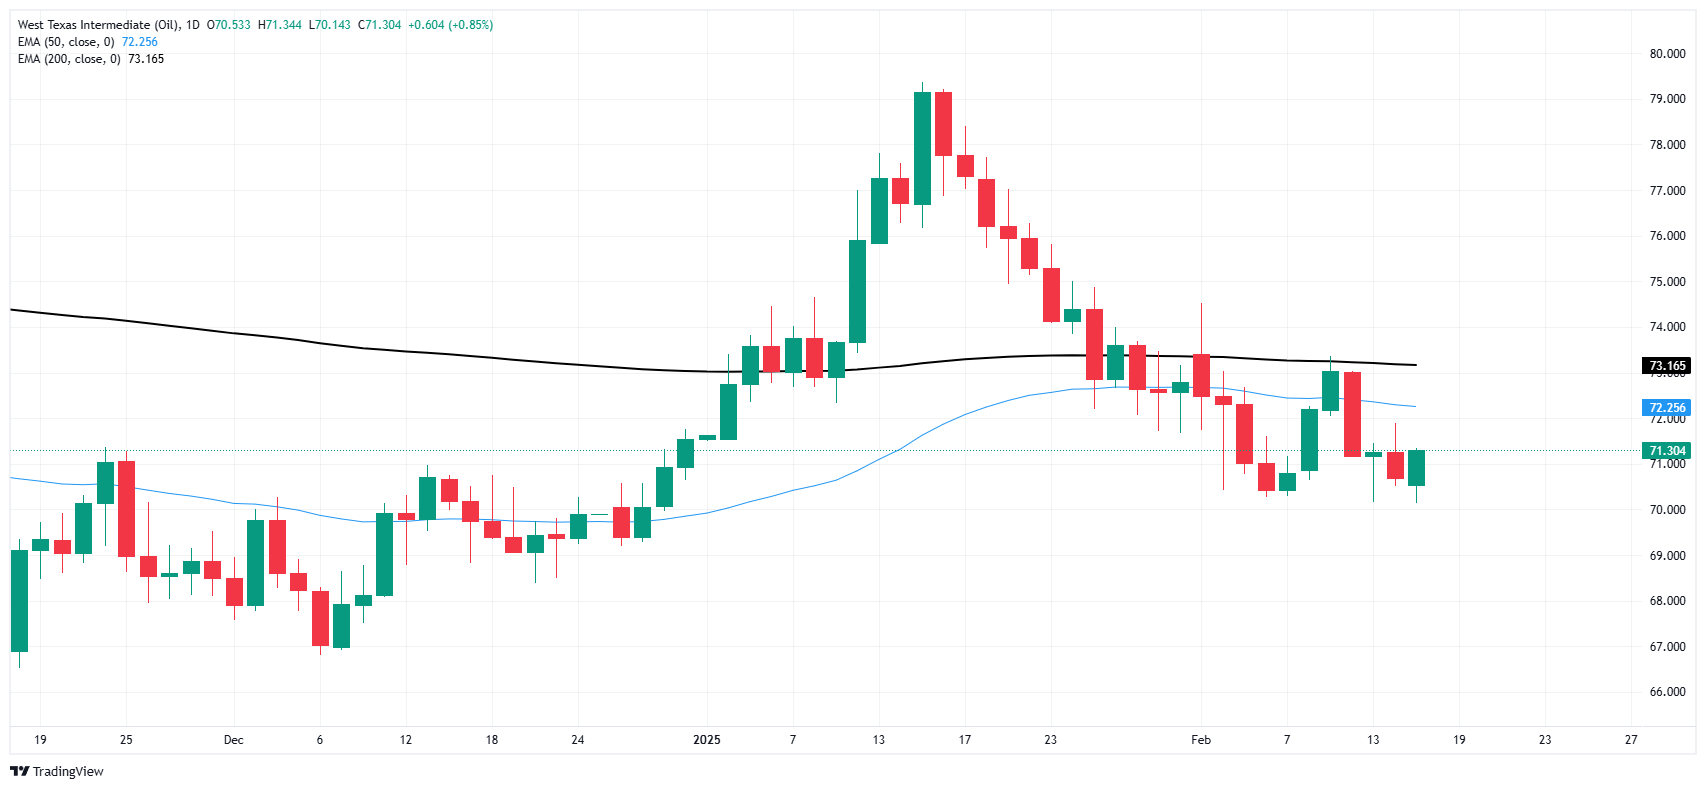
Crude Oil prices caught a bid on Monday, but barrel prices continue to run on the low side of the 50-day Exponential Moving Average (EMA) near $72.25. A near-term decline in energies price action appears to have abated after knocking WTI off its latest swing high above $79.00, dragging bids back below the 200-day EMA near $73.90 in the process. A technical floor is priced in just above the $70.00 major price handle, keeping prices caught in a tight technical range.

WTI daily chart
WTI Oil FAQs

WTI Oil is a type of Crude Oil sold on international markets. The WTI stands for West Texas Intermediate, one of three major types including Brent and Dubai Crude. WTI is also referred to as “light” and “sweet” because of its relatively low gravity and sulfur content respectively. It is considered a high quality Oil that is easily refined. It is sourced in the United States and distributed via the Cushing hub, which is considered “The Pipeline Crossroads of the World”. It is a benchmark for the Oil market and WTI price is frequently quoted in the media.

Like all assets, supply and demand are the key drivers of WTI Oil price. As such, global growth can be a driver of increased demand and vice versa for weak global growth. Political instability, wars, and sanctions can disrupt supply and impact prices. The decisions of OPEC, a group of major Oil-producing countries, is another key driver of price. The value of the US Dollar influences the price of WTI Crude Oil, since Oil is predominantly traded in US Dollars, thus a weaker US Dollar can make Oil more affordable and vice versa.

The weekly Oil inventory reports published by the American Petroleum Institute (API) and the Energy Information Agency (EIA) impact the price of WTI Oil. Changes in inventories reflect fluctuating supply and demand. If the data shows a drop in inventories it can indicate increased demand, pushing up Oil price. Higher inventories can reflect increased supply, pushing down prices. API’s report is published every Tuesday and EIA’s the day after. Their results are usually similar, falling within 1% of each other 75% of the time. The EIA data is considered more reliable, since it is a government agency.

OPEC (Organization of the Petroleum Exporting Countries) is a group of 12 Oil-producing nations who collectively decide production quotas for member countries at twice-yearly meetings. Their decisions often impact WTI Oil prices. When OPEC decides to lower quotas, it can tighten supply, pushing up Oil prices. When OPEC increases production, it has the opposite effect. OPEC+ refers to an expanded group that includes ten extra non-OPEC members, the most notable of which is Russia.


Disclaimer: For information purposes only. Past performance is not indicative of future results.
placeholder
October hike odds climb toward 60% as Goldman and BofA both flip — what Warsh's "dose of accommodation" really changedRate futures now price roughly 55% to 62% for a 25bp hike at the October 27-28 FOMC, up from about 30% before Chair Warsh's post-meeting framing that the Fed is merely "removing some accommodation." Goldman Sachs has added an October hike to its forecast and Bank of America now sees moves in both October and December. Here is the repricing, the language behind it, and the two data points that decide it.
Author  Irene Q.
Sep 23, Wed
Rate futures now price roughly 55% to 62% for a 25bp hike at the October 27-28 FOMC, up from about 30% before Chair Warsh's post-meeting framing that the Fed is merely "removing some accommodation." Goldman Sachs has added an October hike to its forecast and Bank of America now sees moves in both October and December. Here is the repricing, the language behind it, and the two data points that decide it.
placeholder
Strong profits, falling shares: bank earnings day one meets a memory-chip rout — with CPI and ASML aheadGoldman Sachs blew past estimates (EPS $17.01 vs $13.09 expected, profit +33%) while JPMorgan missed ($5.75 vs $5.93) and Wells Fargo fell 3% — yet the S&P 500 finished flat at 7,805.45, pinned below its record close as a memory-chip rout (SOX −2.67%, Micron under $1,000) kept the pressure on. Tonight brings the week's decider: US September CPI at 8:30 ET, then Bank of America, Morgan Stanley, BlackRock and ASML before the open. Here are the levels, both cases, and the watch list.
Author  Irene Q.
Oct 14, Wed
Goldman Sachs blew past estimates (EPS $17.01 vs $13.09 expected, profit +33%) while JPMorgan missed ($5.75 vs $5.93) and Wells Fargo fell 3% — yet the S&P 500 finished flat at 7,805.45, pinned below its record close as a memory-chip rout (SOX −2.67%, Micron under $1,000) kept the pressure on. Tonight brings the week's decider: US September CPI at 8:30 ET, then Bank of America, Morgan Stanley, BlackRock and ASML before the open. Here are the levels, both cases, and the watch list.
placeholder
US September CPI recap: inflation hits 3.7% as core runs hot — is an October Fed hike back on the table?September CPI landed hot: headline 3.7% y/y, core 2.6% y/y and 0.3% m/m. October hike odds jumped from ~22% to ~37% — yet the dollar faded to 101.74, gold closed higher and the S&P 500 fell 1.11%. Here is the full repricing, the levels and what to watch next.
Author  Irene Q.
Yesterday 05: 52
September CPI landed hot: headline 3.7% y/y, core 2.6% y/y and 0.3% m/m. October hike odds jumped from ~22% to ~37% — yet the dollar faded to 101.74, gold closed higher and the S&P 500 fell 1.11%. Here is the full repricing, the levels and what to watch next.
placeholder
Gold defends $4,100 as BofA targets a break below $4,000 — why the Middle East bid is missingSpot gold flushed to $4,099.89, a whisker above October's $4,090 low, then rebounded to close at $4,138.25 (+0.82%) — even as US CPI ran hot. Bank of America sees gold below $4,000 within three months, citing shrinking demand and official-sector selling. Here are the levels, the drivers and what would flip the script.
Author  Irene Q.
Yesterday 06: 57
Spot gold flushed to $4,099.89, a whisker above October's $4,090 low, then rebounded to close at $4,138.25 (+0.82%) — even as US CPI ran hot. Bank of America sees gold below $4,000 within three months, citing shrinking demand and official-sector selling. Here are the levels, the drivers and what would flip the script.
placeholder
Gold Price Analysis Today | Forex Gold Analysis | XAU/USD Analysis - October 15, 2026Get the latest gold price analysis, forex gold insights, and XAU/USD analysis for October 15, 2026. Read on for the details.
Author  Mitrade
Yesterday 07: 01
Get the latest gold price analysis, forex gold insights, and XAU/USD analysis for October 15, 2026. Read on for the details.
goTop
quote