


Gold price rises as US inflation surpasses Fed targets
- Gold climbs to $2016.30, driven by US inflation surpassing forecasts, signaling ongoing price pressure.
- The diminished likelihood of imminent Fed rate cuts enhances Gold's allure as the USD has weakened since last Tuesday.
- The decline in US Treasury and real yields underpin Gold's surge with a rising TIPS yield reflecting higher safe-haven demand.
Gold price extended its gains for three consecutive days after last week’s economic data from the United States (US) revealed that inflation remains above the US Federal Reserve’s (Fed) target. The Consumer Price Index (CPI) and the Producer Price Index (PPI) in January exceeded the consensus, catching traders off guard, which trimmed the odds for a Fed rate cut in March and May. That sponsored a leg-up in the Greenback (USD), which has remained on the defensive since last Tuesday. The XAU/USD exchanges hands at $2016.30.
Traders seeking protection turned to the yellow metal following the latest inflation reports. Additionally, the fall in US Treasury bond yields, particularly the 10-year note that hit a year-to-date (YTD) high of 4.332%, retraced four basis points to 4.293%. Consequently, real yields, which correlate negatively with Gold prices, fell from around 2.04% reached on Wednesday to 1.950%, as reflected by the yield on the US 10-year Treasury Inflation-Protected Securities (TIPS) yield.
Daily digest market movers: Gold advanced despite investors pushing back Fed rate cuts to June
- The CME FedWatch Tool sees traders expect the first 25 bps rate cut by the Fed in June 2024.
- As of today, investors are pricing in 97 basis points of easing throughout 2024.
- The latest inflation reports from the US triggered a change of language from Fed officials, who struck a “cautious” tone. Atlanta Fed President Raphael Bostic suggested the Fed is in no rush to ease policy, saying the Fed could be patient.
- In regard to that, San Francisco Fed President Mary Daly stated, “We will need to resist the temptation to act quickly when patience is needed and be prepared to respond agilely as the economy evolves.”
- This week, the US economic schedule will feature the release of the latest Federal Reserve Open Market Committee (FOMC) Minutes alongside Fed officials' speeches beginning on Wednesday.
- Traders will get further cues from US S&P Global PMIs, Initial Jobless Claims data and the Chicago Fed National Activity Index, usually a prelude to the Institute for Supply Management (ISM) Manufacturing PMI.
Technical Analysis: Gold stays above 100-day SMA, eyes key resistance near $2,030
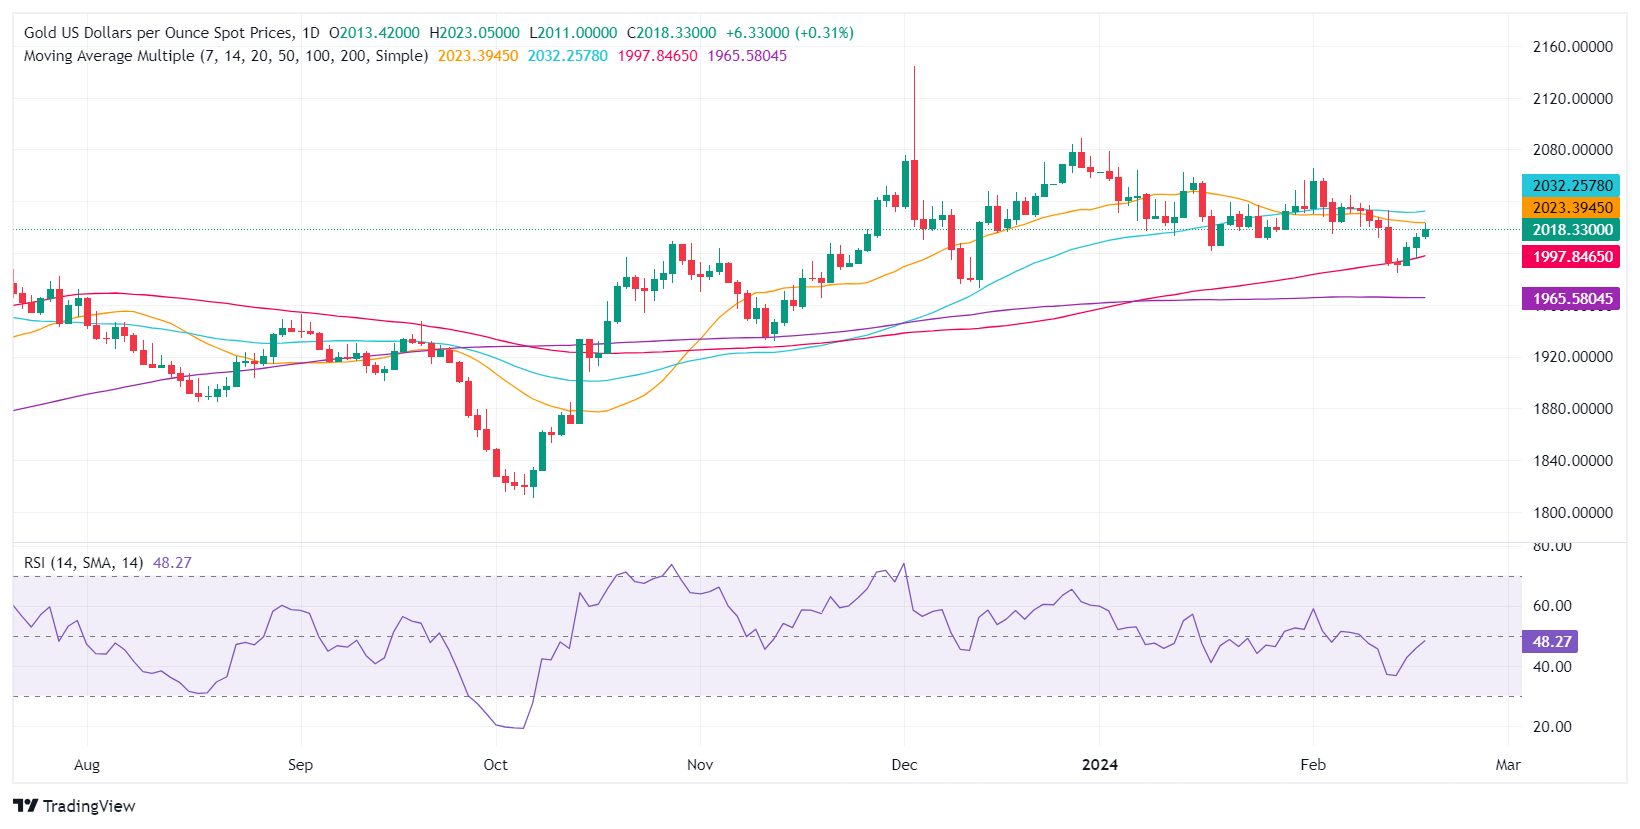
Gold´s daily chart portrays the non-yielding metal as neutral to downwardly biased despite staying above the 200-day Simple Moving Average (SMA) at $1,965.46. If buyers would like to regain control, they must challenge the 50-day SMA at $2,032.71. Once cleared, the next stop would be $2,050, ahead of the latest cycle high at $2,065.60.
On the flip side, if sellers step in and push prices below the $2,000 figure, that will expose the 100-day SMA at $1,998. The next stop would be the December 13 low at $1,973.13, followed by the 200-day SMA at $1,965.47.
Inflation FAQs
What is inflation?
Inflation measures the rise in the price of a representative basket of goods and services. Headline inflation is usually expressed as a percentage change on a month-on-month (MoM) and year-on-year (YoY) basis. Core inflation excludes more volatile elements such as food and fuel which can fluctuate because of geopolitical and seasonal factors. Core inflation is the figure economists focus on and is the level targeted by central banks, which are mandated to keep inflation at a manageable level, usually around 2%.
What is the Consumer Price Index (CPI)?
The Consumer Price Index (CPI) measures the change in prices of a basket of goods and services over a period of time. It is usually expressed as a percentage change on a month-on-month (MoM) and year-on-year (YoY) basis. Core CPI is the figure targeted by central banks as it excludes volatile food and fuel inputs. When Core CPI rises above 2% it usually results in higher interest rates and vice versa when it falls below 2%. Since higher interest rates are positive for a currency, higher inflation usually results in a stronger currency. The opposite is true when inflation falls.
What is the impact of inflation on foreign exchange?
Although it may seem counter-intuitive, high inflation in a country pushes up the value of its currency and vice versa for lower inflation. This is because the central bank will normally raise interest rates to combat the higher inflation, which attract more global capital inflows from investors looking for a lucrative place to park their money.
How does inflation influence the price of Gold?
Formerly, Gold was the asset investors turned to in times of high inflation because it preserved its value, and whilst investors will often still buy Gold for its safe-haven properties in times of extreme market turmoil, this is not the case most of the time. This is because when inflation is high, central banks will put up interest rates to combat it.
Higher interest rates are negative for Gold because they increase the opportunity-cost of holding Gold vis-a-vis an interest-bearing asset or placing the money in a cash deposit account. On the flipside, lower inflation tends to be positive for Gold as it brings interest rates down, making the bright metal a more viable investment alternative.
Recommended Articles


