


Silver Price Forecast: XAG/USD plummets to near $30 amid delay in Trump’s tariff hike plans
- Silver price plunges to near $30.00 as US President Trump delays tariff hikes.
- A delay in Trump tariff plans and hopes of a Russia-Ukraine truce have improved the market mood.
- The Fed is widely anticipated to keep interest rates unchanged on Wednesday.
Silver price (XAG/USD) dives an almost 1.75% to near $30.00 in North American trading hours on Thursday. The white metal has been hit hard as the overall market sentiment has broadly stabilized. The market mood has become favorable for risk-perceived assets as United States (US) President Donald Trump has not imposed tariff hikes yet, while he was anticipated to do the same right on his first day at work.
Donald Trump has commented that he is considering 25% tariff hikes on Mexico and Canada and 10% on China that will come into effect from February 1. His presidential memo also suggested that tariffs are not coming swiftly, and he directed federal agencies to study trade policies and evaluate trade relationships. No concrete announcement of tariff hikes has eased the risk-aversion mood as market participants expect Trump’s tariff policy implementation will be more gradual than feared.
Apart from growing expectations that Russia might have a truce with Ukraine, it has also trimmed the risk premium of precious metals. Trump has threatened to impose sanctions on Russia if he continues the war with Ukraine.
Historically, the safe-haven demand for precious metals, such as Silver, diminishes in a stable risk environment.
Meanwhile, the US Dollar Index (DXY), which tracks the Greenback’s value against six major currencies, trades subduedly after gaining ground post refreshing the two-week low of 107.75. The US Dollar (USD) is expected to remain broadly sideways, with investors awaiting the Federal Reserve’s (Fed) monetary policy decision on Wednesday. The Fed is almost certain to announce a pause to the current policy-easing spell and leave interest rates unchanged in the range of 4.25%-4.50%.
Silver technical analysis
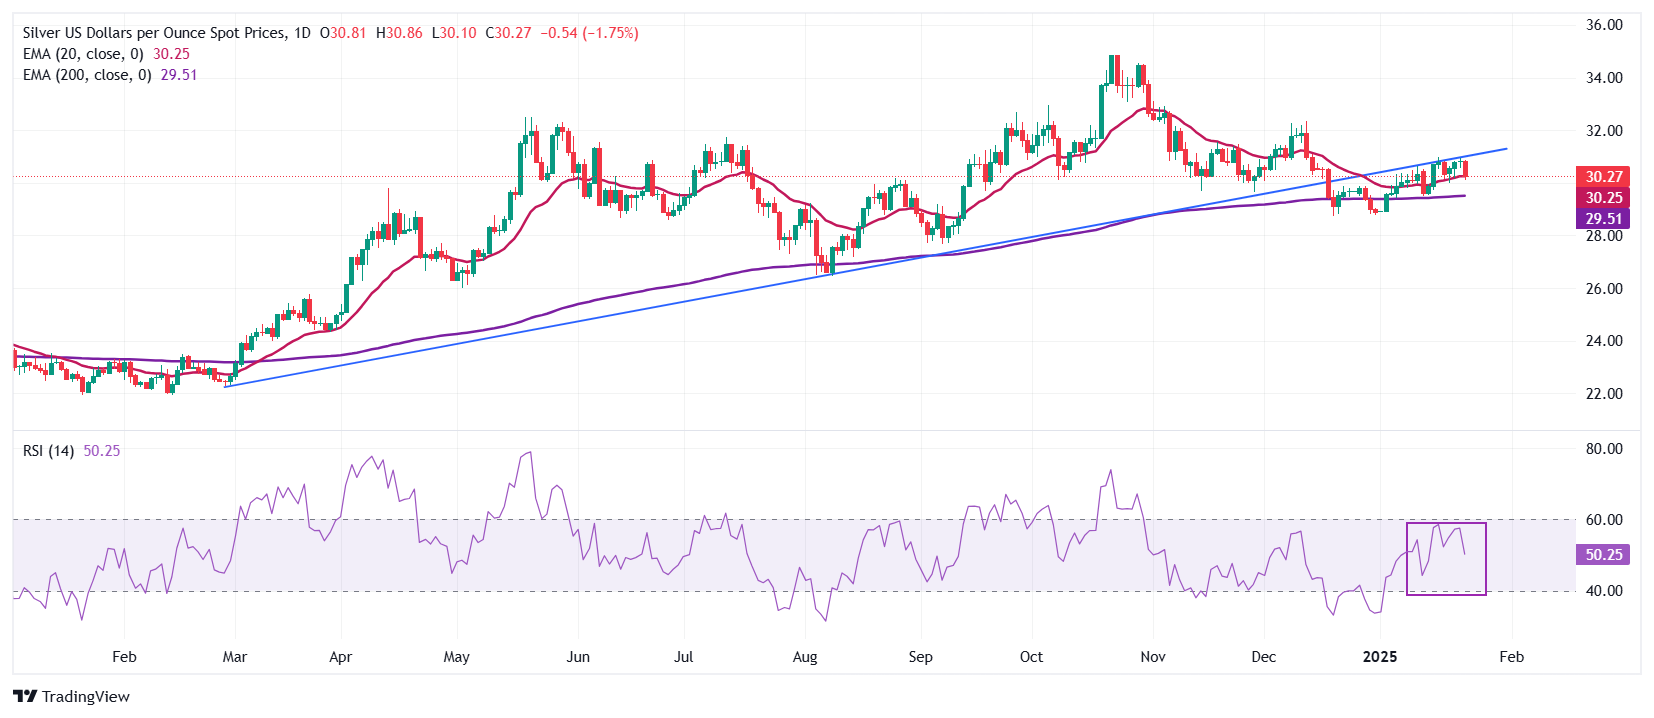
Silver price falls back to near the 20-day Exponential Moving Average (EMA) around $30.25 after failing to break above the upward-sloping trendline around $30.90, which is plotted from 29 February 2024 low of $22.30 on a daily timeframe.
The broader outlook of the Silver price remains firm above the 200-day Exponential Moving Average (EMA), which trades around $29.50.
The 14-day Relative Strength Index (RSI) oscillates in the 40.00-60.00 range, suggesting a sideways trend.
Silver daily chart
Silver FAQs
Silver is a precious metal highly traded among investors. It has been historically used as a store of value and a medium of exchange. Although less popular than Gold, traders may turn to Silver to diversify their investment portfolio, for its intrinsic value or as a potential hedge during high-inflation periods. Investors can buy physical Silver, in coins or in bars, or trade it through vehicles such as Exchange Traded Funds, which track its price on international markets.
Silver prices can move due to a wide range of factors. Geopolitical instability or fears of a deep recession can make Silver price escalate due to its safe-haven status, although to a lesser extent than Gold's. As a yieldless asset, Silver tends to rise with lower interest rates. Its moves also depend on how the US Dollar (USD) behaves as the asset is priced in dollars (XAG/USD). A strong Dollar tends to keep the price of Silver at bay, whereas a weaker Dollar is likely to propel prices up. Other factors such as investment demand, mining supply – Silver is much more abundant than Gold – and recycling rates can also affect prices.
Silver is widely used in industry, particularly in sectors such as electronics or solar energy, as it has one of the highest electric conductivity of all metals – more than Copper and Gold. A surge in demand can increase prices, while a decline tends to lower them. Dynamics in the US, Chinese and Indian economies can also contribute to price swings: for the US and particularly China, their big industrial sectors use Silver in various processes; in India, consumers’ demand for the precious metal for jewellery also plays a key role in setting prices.
Silver prices tend to follow Gold's moves. When Gold prices rise, Silver typically follows suit, as their status as safe-haven assets is similar. The Gold/Silver ratio, which shows the number of ounces of Silver needed to equal the value of one ounce of Gold, may help to determine the relative valuation between both metals. Some investors may consider a high ratio as an indicator that Silver is undervalued, or Gold is overvalued. On the contrary, a low ratio might suggest that Gold is undervalued relative to Silver.
Recommended Articles


