

Silver Price Forecast: XAG/USD corrects from over one-month top, slides to mid-$30.00s
- Silver faces rejection near the 100-day SMA and descending channel resistance.
- A move beyond the $31.00 is needed to support prospects for additional gains.
- A convincing break below the $30.00 mark could expose the multi-month low.
Silver (XAG/USD) drifts lower on Thursday and for now, seems to have snapped a three-day winning streak to the highest level since December 13, around the $31.00 neighborhood touched the previous day. The white metal retains its negative bias through the first half of the European session on Thursday and currently trades around the $30.55 zone, down over 0.85% for the day.
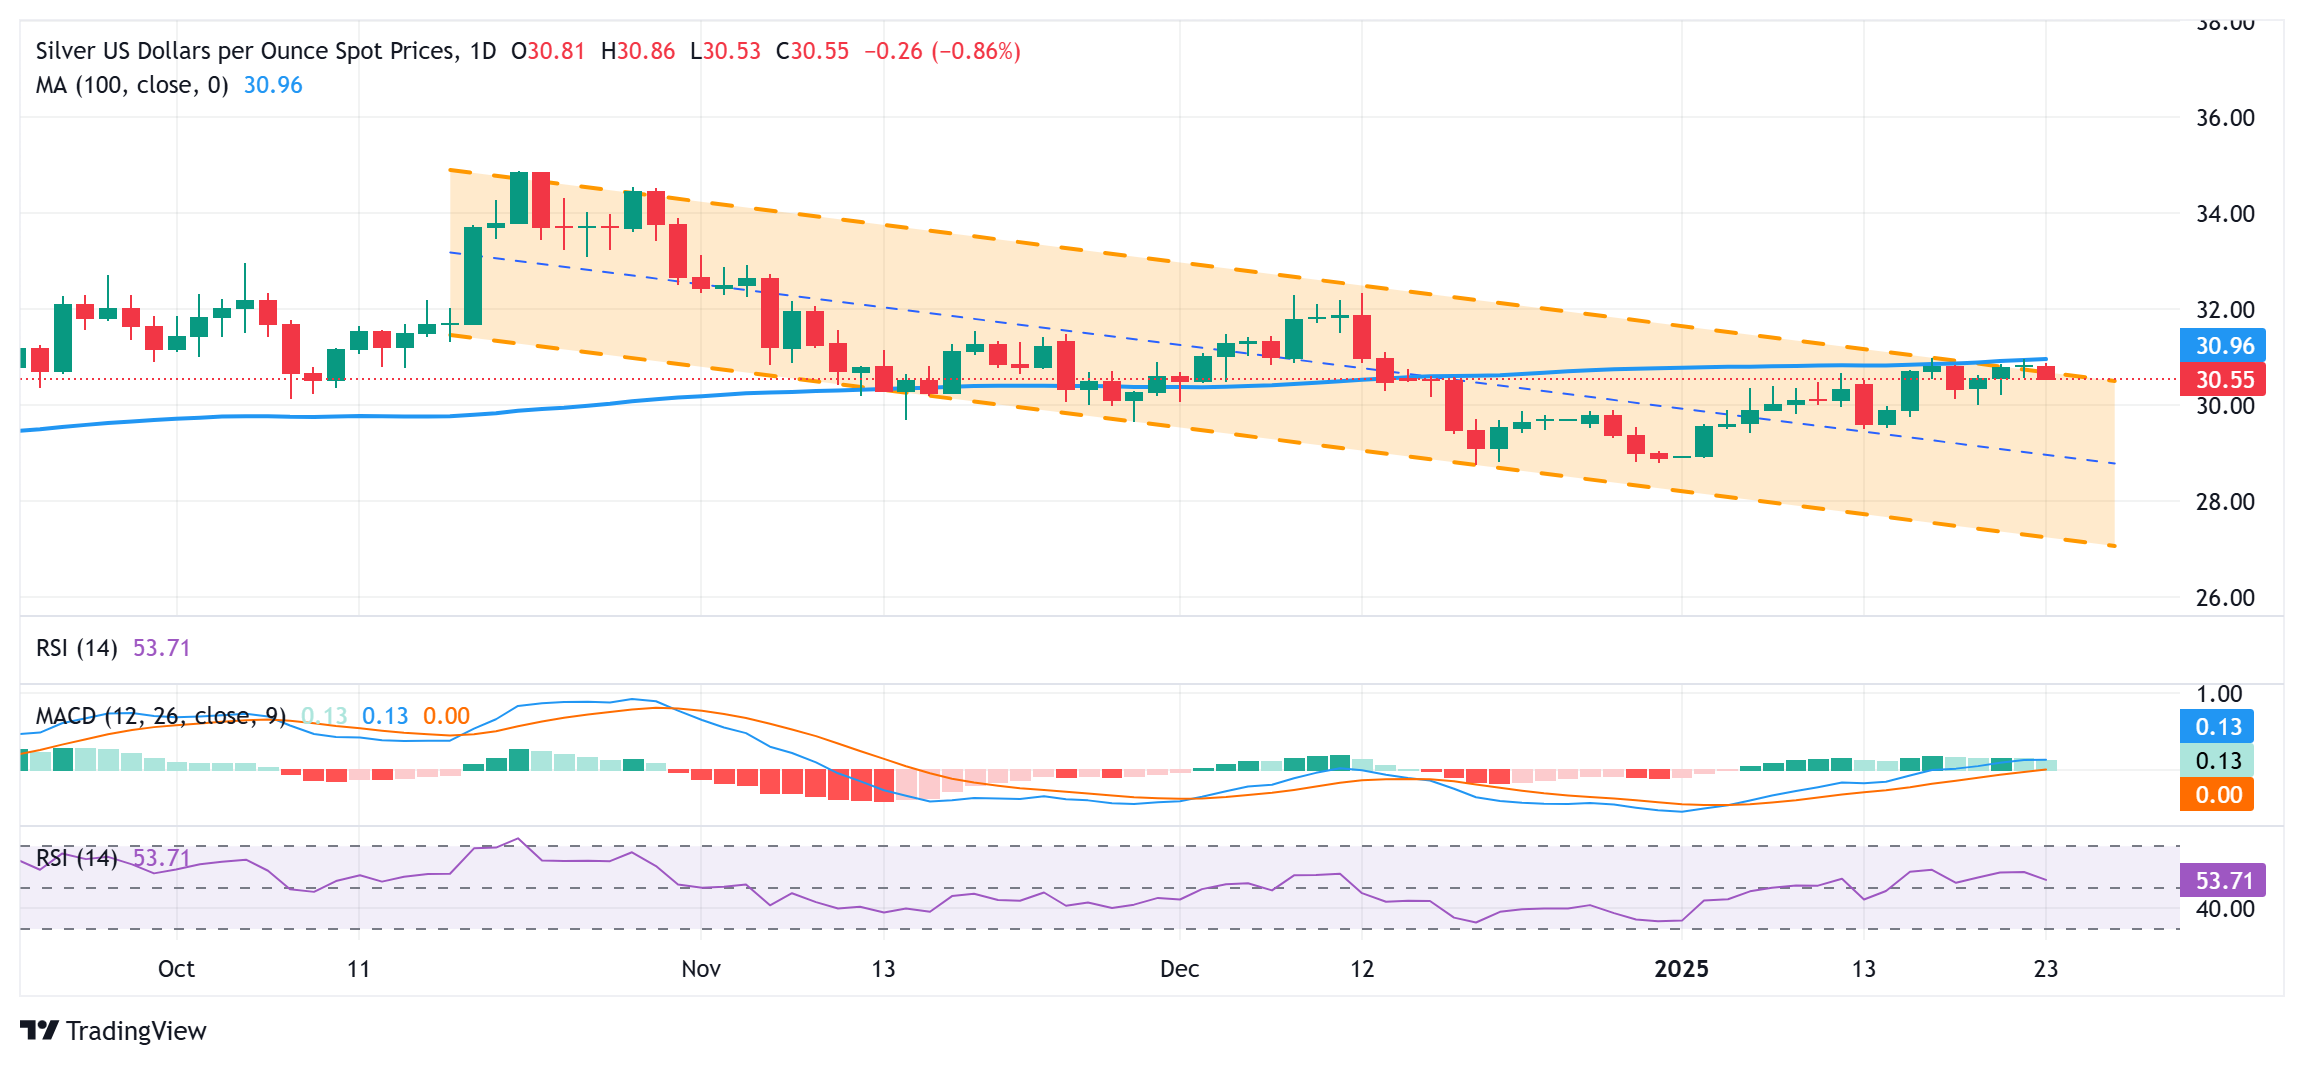
From a technical perspective, the $31.00 mark represents a confluence hurdle – comprising the 100-day Simple Moving Average (SMA) and the top end of a multi-month-old descending channel. The said barrier should now act as a key pivotal point, which if cleared decisively should pave the way for additional near-term gains. Given that oscillators on the daily chart are holding in positive territory, the XAG/USD could surpass the $31.25 intermediate hurdle and climb to the $31.45-$31.50 resistance. The momentum could extend further towards reclaiming the $32.00 round figure en route to the December swing high, around the $32.25-$32.30 area.
On the flip side, any further decline is likely to find decent support and attract some buyers near the $30.00 psychological mark. A convincing break below could make the XAG/USD vulnerable to accelerate the slide towards the $29.60 region before eventually dropping to test sub-$29.00 levels, or the multi-month low touched in December. Some follow-through selling could expose the descending channel support, currently pegged near the $27.35 region, with some intermediate support near the $28.30 area, $28.00 round figure and the $27.70-$27.65 zone.
Silver daily chart
Silver FAQs
Silver is a precious metal highly traded among investors. It has been historically used as a store of value and a medium of exchange. Although less popular than Gold, traders may turn to Silver to diversify their investment portfolio, for its intrinsic value or as a potential hedge during high-inflation periods. Investors can buy physical Silver, in coins or in bars, or trade it through vehicles such as Exchange Traded Funds, which track its price on international markets.
Silver prices can move due to a wide range of factors. Geopolitical instability or fears of a deep recession can make Silver price escalate due to its safe-haven status, although to a lesser extent than Gold's. As a yieldless asset, Silver tends to rise with lower interest rates. Its moves also depend on how the US Dollar (USD) behaves as the asset is priced in dollars (XAG/USD). A strong Dollar tends to keep the price of Silver at bay, whereas a weaker Dollar is likely to propel prices up. Other factors such as investment demand, mining supply – Silver is much more abundant than Gold – and recycling rates can also affect prices.
Silver is widely used in industry, particularly in sectors such as electronics or solar energy, as it has one of the highest electric conductivity of all metals – more than Copper and Gold. A surge in demand can increase prices, while a decline tends to lower them. Dynamics in the US, Chinese and Indian economies can also contribute to price swings: for the US and particularly China, their big industrial sectors use Silver in various processes; in India, consumers’ demand for the precious metal for jewellery also plays a key role in setting prices.
Silver prices tend to follow Gold's moves. When Gold prices rise, Silver typically follows suit, as their status as safe-haven assets is similar. The Gold/Silver ratio, which shows the number of ounces of Silver needed to equal the value of one ounce of Gold, may help to determine the relative valuation between both metals. Some investors may consider a high ratio as an indicator that Silver is undervalued, or Gold is overvalued. On the contrary, a low ratio might suggest that Gold is undervalued relative to Silver.
Recommended Articles


