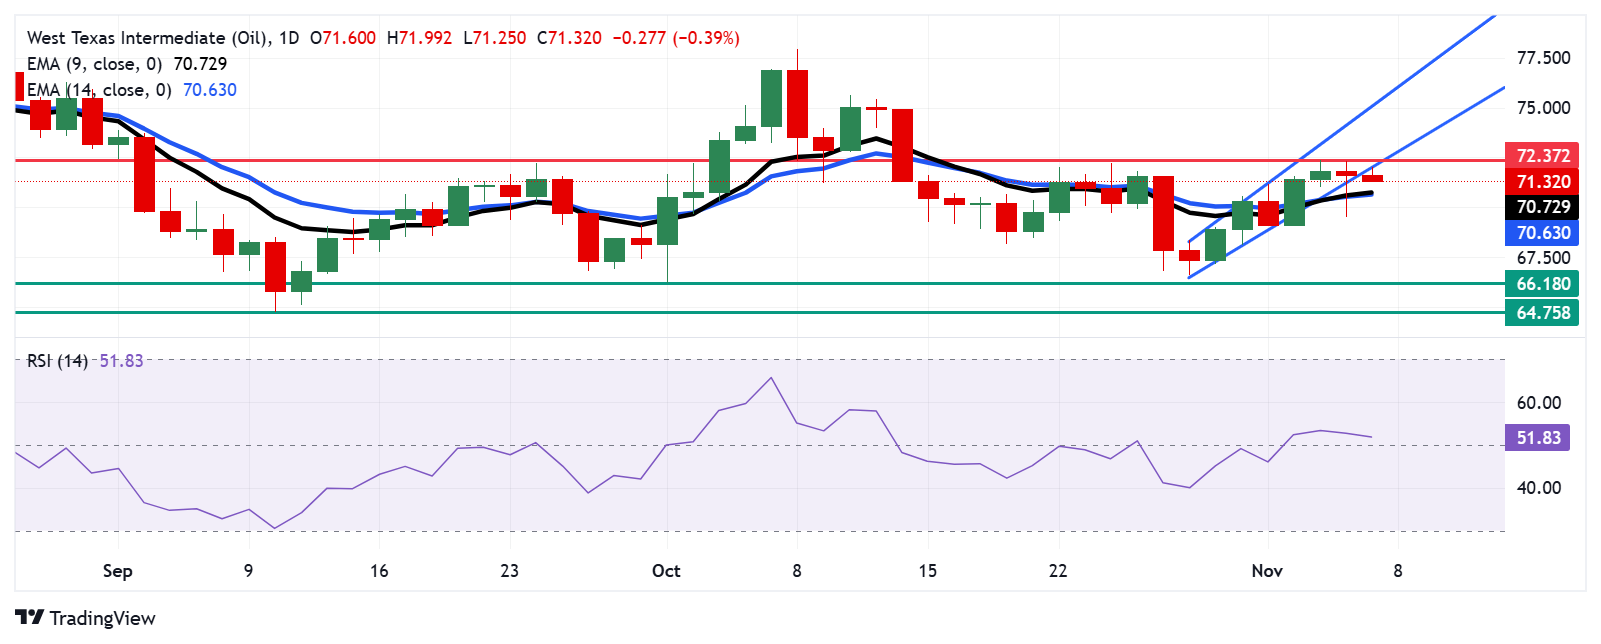
WTI Price Forecast: Breaks below $71.50, ascending channel pattern
- WTI price may find immediate support at a nine-day EMA at $70.72, aligned with and 14-day EMA at $72.62.
- If the 14-day RSI falls below the 50 level, it could signal the start of a bearish trend.
- WTI price may find resistance to re-entering the ascending channel.
West Texas Intermediate (WTI) Oil price extends its losses for the second successive session, trading around $71.40 per barrel during the early European hours on Thursday. The technical analysis of a daily chart indicates a weakening bullish bias as the pair has broken below the ascending channel pattern.
However, the 14-day Relative Strength Index (RSI) consolidates just above the 50 level, indicating a bullish bias is still in play. A break below the 50 mark would cause an emergence of a bearish trend.
Additionally, the WTI price is positioned above the nine- and 14-day Exponential Moving Average (EMA), suggesting a bullish momentum in the short-term trend.
In terms of support, WTI price could test the nine-day EMA at $70.72, followed by the 14-day EMA at $70.62. A break below these EMAs would increase downward pressure on the Oil price to navigate the region around a two-month low at $66.18 level, which was observed on October 1.
Additional support emerges near the $64.75 level, the lowest point since May 2023, last recorded on September 10.
On the upside, WTI price may attempt to re-enter the ascending channel pattern around the three-week high of $72.37 level, which was marked on November 5. A return into the channel would reinforce the bullish bias and support the pair to navigate the region around the upper boundary of the channel near the $75.10 level.
WTI Price: Daily Chart

WTI Oil FAQs
WTI Oil is a type of Crude Oil sold on international markets. The WTI stands for West Texas Intermediate, one of three major types including Brent and Dubai Crude. WTI is also referred to as “light” and “sweet” because of its relatively low gravity and sulfur content respectively. It is considered a high quality Oil that is easily refined. It is sourced in the United States and distributed via the Cushing hub, which is considered “The Pipeline Crossroads of the World”. It is a benchmark for the Oil market and WTI price is frequently quoted in the media.
Like all assets, supply and demand are the key drivers of WTI Oil price. As such, global growth can be a driver of increased demand and vice versa for weak global growth. Political instability, wars, and sanctions can disrupt supply and impact prices. The decisions of OPEC, a group of major Oil-producing countries, is another key driver of price. The value of the US Dollar influences the price of WTI Crude Oil, since Oil is predominantly traded in US Dollars, thus a weaker US Dollar can make Oil more affordable and vice versa.
The weekly Oil inventory reports published by the American Petroleum Institute (API) and the Energy Information Agency (EIA) impact the price of WTI Oil. Changes in inventories reflect fluctuating supply and demand. If the data shows a drop in inventories it can indicate increased demand, pushing up Oil price. Higher inventories can reflect increased supply, pushing down prices. API’s report is published every Tuesday and EIA’s the day after. Their results are usually similar, falling within 1% of each other 75% of the time. The EIA data is considered more reliable, since it is a government agency.
OPEC (Organization of the Petroleum Exporting Countries) is a group of 12 Oil-producing nations who collectively decide production quotas for member countries at twice-yearly meetings. Their decisions often impact WTI Oil prices. When OPEC decides to lower quotas, it can tighten supply, pushing up Oil prices. When OPEC increases production, it has the opposite effect. OPEC+ refers to an expanded group that includes ten extra non-OPEC members, the most notable of which is Russia.


