


Silver Price Forecast: XAG/USD nosedives to near $31.00 on Trump’s victory, Fed policy in focus
- Silver price plunges below $31.00 as Trump’s victory dampens its safe-haven appeal.
- Higher US Treasury yields and the US Dollar have weighed on the Silver price.
- Investors will focus on the Fed’s commentary to get cues about the impact of Trump’s victory on the interest rate path.
Silver price (XAG/USD) faces a bloodbath on a landslide victory of Republican candidate Donald Trump, is down almost 5% and falls below $31.00 in Wednesday’s North American session. The white metal weakens as investors expect that Trump would effort for a truce between Russia and Ukraine. A ceasefire of more than two Russia-Ukraine wars will improve global market sentiment.
Bloodshed between Russia and Ukraine was one of the reasons behind Silver’s rally, from a low of $18.00 to a more than decade high of around $35.00 in the past two years. Historically, the scenario of geopolitical tensions bodes well for precious metals, such as Silver, as it improves its safe-haven appeal.
Meanwhile, a sheer strength in the US Dollar (USD) and bond yields has also weighed on the Silver. The US Dollar Index (DXY), which gauges Greenback’s value against six major currencies, posts a fresh four-month high of 105.30. 10-year US Treasury yields soar to near 4.45%. Higher yields on interest-bearing assets increase the opportunity cost of holding an investment in non-yielding assets, such as Silver.
US Dollar PRICE Today
The table below shows the percentage change of US Dollar (USD) against listed major currencies today. US Dollar was the strongest against the Euro.
| USD | EUR | GBP | JPY | CAD | AUD | NZD | CHF | |
|---|---|---|---|---|---|---|---|---|
| USD | 1.96% | 1.26% | 1.82% | 0.78% | 1.25% | 0.93% | 1.45% | |
| EUR | -1.96% | -0.67% | -0.13% | -1.15% | -0.69% | -1.02% | -0.50% | |
| GBP | -1.26% | 0.67% | 0.54% | -0.47% | -0.02% | -0.35% | 0.18% | |
| JPY | -1.82% | 0.13% | -0.54% | -1.01% | -0.56% | -0.90% | -0.36% | |
| CAD | -0.78% | 1.15% | 0.47% | 1.01% | 0.46% | 0.13% | 0.65% | |
| AUD | -1.25% | 0.69% | 0.02% | 0.56% | -0.46% | -0.33% | 0.20% | |
| NZD | -0.93% | 1.02% | 0.35% | 0.90% | -0.13% | 0.33% | 0.53% | |
| CHF | -1.45% | 0.50% | -0.18% | 0.36% | -0.65% | -0.20% | -0.53% |
The heat map shows percentage changes of major currencies against each other. The base currency is picked from the left column, while the quote currency is picked from the top row. For example, if you pick the US Dollar from the left column and move along the horizontal line to the Japanese Yen, the percentage change displayed in the box will represent USD (base)/JPY (quote).
Going forward, investors will focus on the Federal Reserve’s (Fed) interest rate decision, which will be announced on Thursday. The Fed is widely anticipated to cut interest rates by 25 basis points (bps) to 4.50%-4.75%, according to the CME FedWatch tool. Investors will focus on the Fed’s comments on the impact of Trump’s victory on the inflation outlook and the interest rate guidance.
Trump vowed to lower corporate taxes and hike import tariffs by 10% universally, except China which is expected to face tariffs even higher.
Silver technical analysis
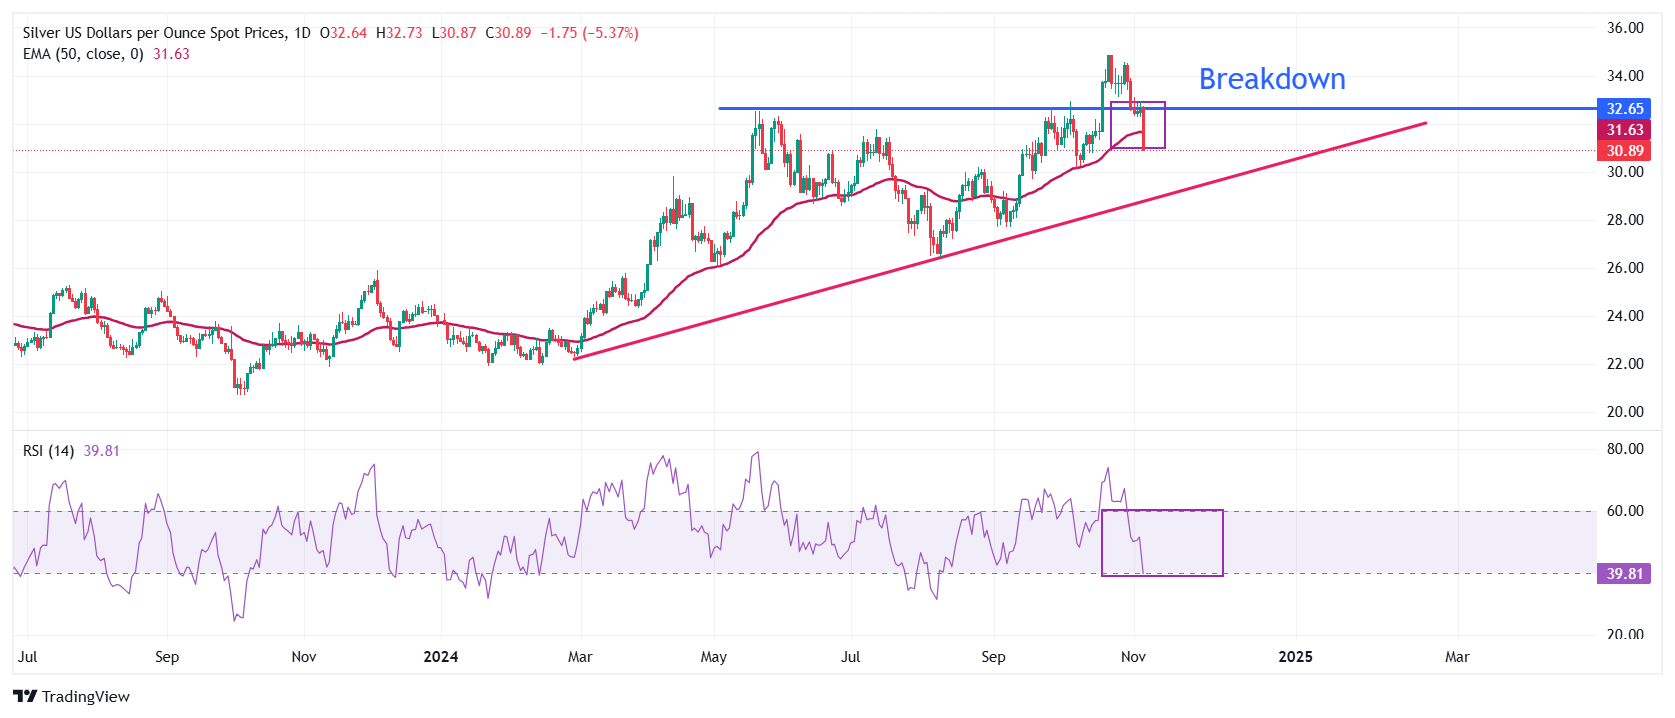
Silver price extends its downside below $31.00 after sliding below the horizontal support plotted from the May 21 high of $32.50. The near-term trend of the Silver price has turned bearish as it has dropped below the 50-day Exponential Moving Average (EMA), which trades around $31.60.
The asset could find support near the upward-sloping trendline around $29.00, plotted from the February 28 low of $22.30.
The 14-day Relative Strength Index (RSI) dives to near 40.00. Should RSI (14) fall below 40.00, a bearish momentum will be triggered.
Silver daily chart
Recommended Articles


