

Silver Price Forecast: XAG/USD jumps to near $31.50 after US PPI release
- Silver price rises to near $31.50 after the release of the US PPI data for September.
- The annual headline and core PPI grew faster than expected.
- The Fed is expected to cut interest rates again in November.
Silver price (XAG/USD) climbs to near $31.50 in Friday’s New York session. The white metal gains while the US Dollar (USD) remains steady after the release of the United States (US) Producer Price Index (PPI) data for September.
The US Dollar Index (DXY), which tracks the Greenback’s value against six major currencies, wobbles around 103.00.
The PPI report showed that the annual headline producer inflation grew by 1.8%, faster than estimates of 1.6%. However, it remained slower than 1.9% in August, upwardly revised from 1.7%. The annual core PPI – which excludes volatile food and energy prices – accelerated at a faster-than-expected pace to 2.8% from expectations of 2.7% and the former release of 2.6%, upwardly revised from 2.4%.
Meanwhile, the month-on-month headline producer inflation remained flat, strengthening the case for further interest rate cuts by the Federal Reserve (Fed). According to the CME FedWatch tool, 30-day Federal Fund Futures pricing data shows that the central bank will cut its borrowing rates by 25 basis points (bps) to 4.50%-4.75% in November.
The Fed started the policy-easing cycle with a 50-bps interest rate cut in September as Fed officials were concerned over growing job market risks, with confidence that price pressures will sustainably return to the bank’s target of 2%.
Silver technical analysis
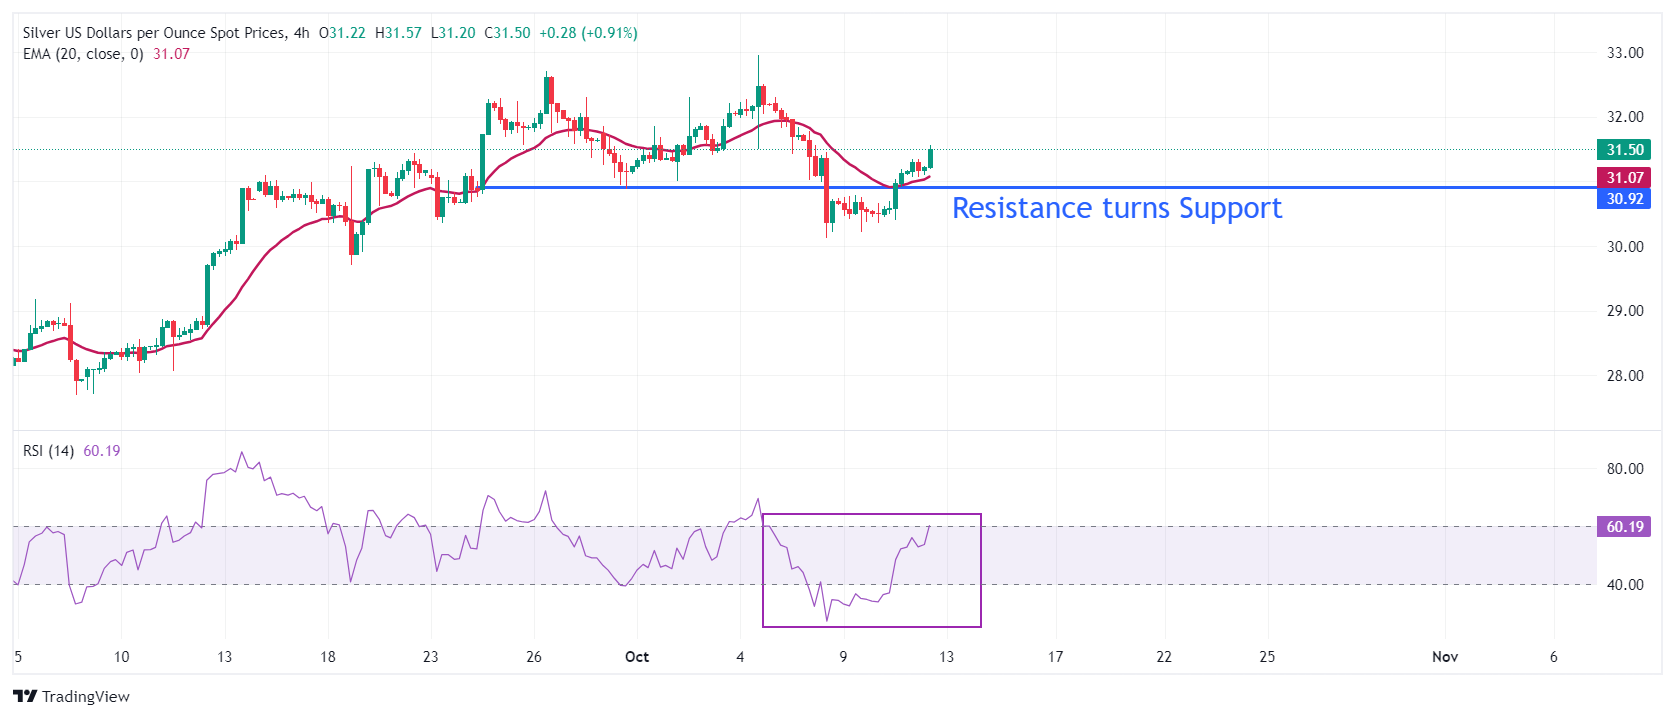
Silver price strengthens after breaking above the horizontal resistance plotted from the September 30 low of $31.30, which is expected to act as support ahead. The near-term outlook of the Silver price has become upbeat as it has climbed above the 20-period Exponential Moving Average (EMA), which trades around $31.50. The asset is expected to extend its upside toward an October high of around $33.00.
The 14-period Relative Strength Index (RSI) climbs to near 60.00. A bullish momentum would trigger if the RSI breaks above 60.00.
Silver four-hour chart
`
Silver FAQs
Silver is a precious metal highly traded among investors. It has been historically used as a store of value and a medium of exchange. Although less popular than Gold, traders may turn to Silver to diversify their investment portfolio, for its intrinsic value or as a potential hedge during high-inflation periods. Investors can buy physical Silver, in coins or in bars, or trade it through vehicles such as Exchange Traded Funds, which track its price on international markets.
Silver prices can move due to a wide range of factors. Geopolitical instability or fears of a deep recession can make Silver price escalate due to its safe-haven status, although to a lesser extent than Gold's. As a yieldless asset, Silver tends to rise with lower interest rates. Its moves also depend on how the US Dollar (USD) behaves as the asset is priced in dollars (XAG/USD). A strong Dollar tends to keep the price of Silver at bay, whereas a weaker Dollar is likely to propel prices up. Other factors such as investment demand, mining supply – Silver is much more abundant than Gold – and recycling rates can also affect prices.
Silver is widely used in industry, particularly in sectors such as electronics or solar energy, as it has one of the highest electric conductivity of all metals – more than Copper and Gold. A surge in demand can increase prices, while a decline tends to lower them. Dynamics in the US, Chinese and Indian economies can also contribute to price swings: for the US and particularly China, their big industrial sectors use Silver in various processes; in India, consumers’ demand for the precious metal for jewellery also plays a key role in setting prices.
Silver prices tend to follow Gold's moves. When Gold prices rise, Silver typically follows suit, as their status as safe-haven assets is similar. The Gold/Silver ratio, which shows the number of ounces of Silver needed to equal the value of one ounce of Gold, may help to determine the relative valuation between both metals. Some investors may consider a high ratio as an indicator that Silver is undervalued, or Gold is overvalued. On the contrary, a low ratio might suggest that Gold is undervalued relative to Silver.
Recommended Articles


