Silver Price Forecast: XAG/USD looks indecisive, flat lines above $31.00 mark

Source Fxstreet
  • Silver oscillates in a range on the last trading day of the week. 
  • A mixed technical setup warrants caution for aggressive traders.
  • Acceptance above $32.00 will set the stage for additional gains.

Silver (XAG/USD) struggles to capitalize on its modest intraday uptick and trades around the $31.15 region during the first half of the European session on Friday, nearly unchanged for the day.

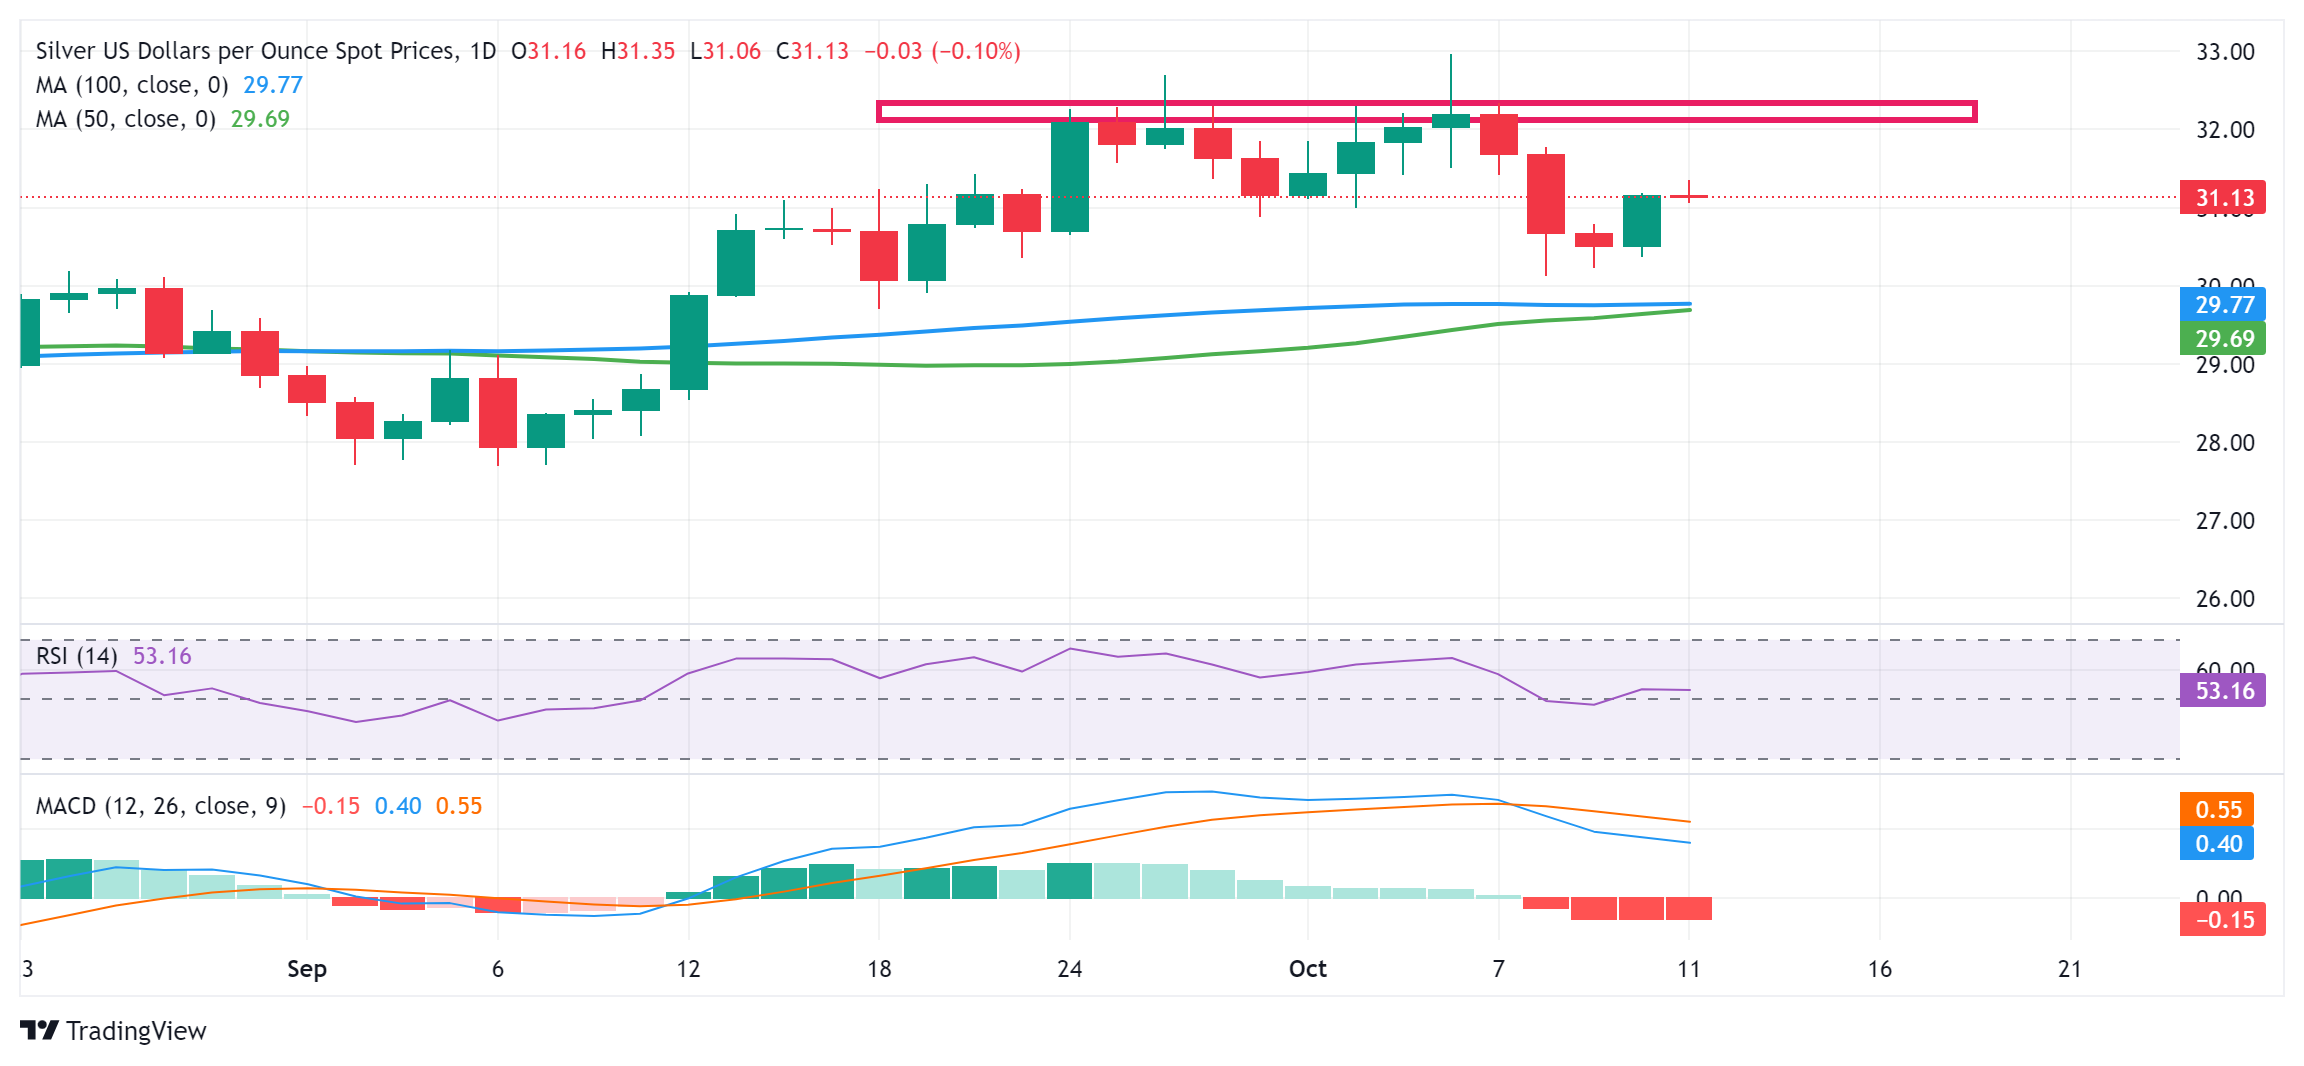
Looking at the broader picture, this week's bounce from the vicinity of the $30.00 psychological mark and a subsequent strength back above the $31.00 mark favors bullish traders. That said, the recent repeated failures to capitalize on momentum beyond the $32.00 mark constitute the formation of a bearish multiple-tops pattern. This, along with mixed oscillators on the daily chart, warrants caution before positioning for any meaningful appreciating move for the XAG/USD. 

From current levels, the $31.55 region is likely to act as an immediate hurdle ahead of the $31.75-$31.80 area and the $32.00 mark. This is followed by resistance near the 32.25 supply zone, which if cleared decisively has the potential to lift the XAG/USD back towards the multi-year peak, just ahead of the $33.00 round figure touched last Friday. Some follow-through buying should pave the way for a move towards the December 2012 swing high, around the $33.85 region. 

On the flip side, weakness below the $31.00 round figure now seems to find some support near the $30.70-$30.65 region ahead of the $30.35-$30.25 area and the $30.00 mark. The next relevant support is pegged near the $29.80-$29.70 confluence – comprising the 100-day Simple Moving Average (SMA) and the 50-day SMA. This should act as a key pivotal point, which if broken will set the stage for an extension of the recent decline from the highest level since December 2012. 

The XAG/USD might then accelerate the downfall towards the $29.00 mark before eventually dropping to test the $28.60-$28.50 zone. The descending trend could extend further towards the $28.10-$28.00 region en route to the September monthly swing low, around the $27.70 area.

Silver daily chart

fxsoriginal

Disclaimer: For information purposes only. Past performance is not indicative of future results.
placeholder
Will ETH, BNB, XRP, SOL and DOGE Outperform in a 2026 Altseason?The cryptocurrency market showed selective altcoin outperformance in 2025, with Bitcoin maintaining a high dominance, suggesting continued investor preference for BTC.
Author  Mitrade
Dec 24, 2025
The cryptocurrency market showed selective altcoin outperformance in 2025, with Bitcoin maintaining a high dominance, suggesting continued investor preference for BTC.
placeholder
ECB Policy Outlook for 2026: What It Could Mean for the Euro’s Next MoveWith the ECB likely holding rates steady at 2.15% and the Fed potentially extending cuts into 2026, EUR/USD may test 1.20 if Eurozone growth proves resilient, but weaker growth and an ECB pivot could pull the pair back toward 1.13 and potentially 1.10.
Author  Mitrade
Dec 26, 2025
With the ECB likely holding rates steady at 2.15% and the Fed potentially extending cuts into 2026, EUR/USD may test 1.20 if Eurozone growth proves resilient, but weaker growth and an ECB pivot could pull the pair back toward 1.13 and potentially 1.10.
placeholder
My Top 5 Stock Market Predictions for 2026Five 2026 market predictions written in a native, news-style voice: AI’s winners and losers, broader sector leadership, dividend demand, valuation cooling as the Shiller CAPE sits at 39 (Dec. 31, 2025), and quantum-computing bursts—while keeping all original facts and numbers unchanged.
Author  Mitrade
Jan 06, Tue
Five 2026 market predictions written in a native, news-style voice: AI’s winners and losers, broader sector leadership, dividend demand, valuation cooling as the Shiller CAPE sits at 39 (Dec. 31, 2025), and quantum-computing bursts—while keeping all original facts and numbers unchanged.
placeholder
WTI rises to near $93.00 as Iran launches missiles toward Kuwait, BahrainWest Texas Intermediate (WTI) gains ground for the third successive day, trading around $92.90 per barrel during the Asian hours on Wednesday.
Author  FXStreet
Jun 03, Wed
West Texas Intermediate (WTI) gains ground for the third successive day, trading around $92.90 per barrel during the Asian hours on Wednesday.
placeholder
Bitcoin Supply In Loss Crosses Critical Threshold — Bullish Reversal Next?After days of steep downward movement, the price of Bitcoin appears to have found a somewhat reliable anchor around the $60,000 region. However, recent on-chain data suggests that the premier
Author  NewsBTC
Yesterday 01: 16
After days of steep downward movement, the price of Bitcoin appears to have found a somewhat reliable anchor around the $60,000 region. However, recent on-chain data suggests that the premier
Related Instrument
goTop
quote