

Gold keeps knocking at the door of all-time-highs
- Gold trades in a narrow range just below its record highs.
- US “factory gate” price inflation and the ECB meeting could impact the precious metal on Thursday.
- Risk sentiment turns upbeat, however, curbing enthusiasm for the safe-haven.
Gold (XAU/USD) continues trading in its established range just below its all-time high on Thursday, as traders await more US inflation data, this time in the form of “factory gate” price inflation, or the Producer Price Index (PPI) for August. The data could further impact expectations regarding the trajectory of US interest rates, which in turn will likely impact both the price of Gold and the US Dollar (USD).
In addition, Thursday’s European Central Bank (ECB) meeting could further impact Gold price, depending on how much easing the ECB decides to implement. The bank will also republish its economic projections, with fears it could radically revise down economic growth and inflation forecasts for the region in light of recent downbeat data from Germany, the largest member of the bloc.
Market sentiment turns positive, meanwhile, after Asian stocks rose overnight, commodities rebounded, and European bourses clock gains. The upbeat mood is likely to weigh on safe-haven Gold.
Gold fell after US inflation data showed rise in core component
Gold price weakened on Wednesday, falling from the range highs to a low of around $2,500 after the release of US Consumer Price Index (CPI) data for August showed a higher-than-expected uptick in core CPI of 0.3% versus expectations of 0.2% and 0.2% previously.
The stickier-than-expected core CPI led traders to downgrade the probabilities of the Federal Reserve (Fed) cutting interest rates by a larger 0.50% at their meeting next week, with expectations rising for a more cautious 0.25% cut instead.
The data lifted the US Dollar but weighed on Gold as the expectation that interest rates might remain elevated for longer reduces the attractiveness of non-interest-paying assets, like Gold.
The release of PPI data on Thursday, as well as the conclusion of the ECB policy meeting, could further calibrate expectations regarding the future course of interest rates globally – a key driver for Gold.
US Jobless Claims data could also influence the trajectory of the yellow metal given the Fed’s focus on the weakening labor market.
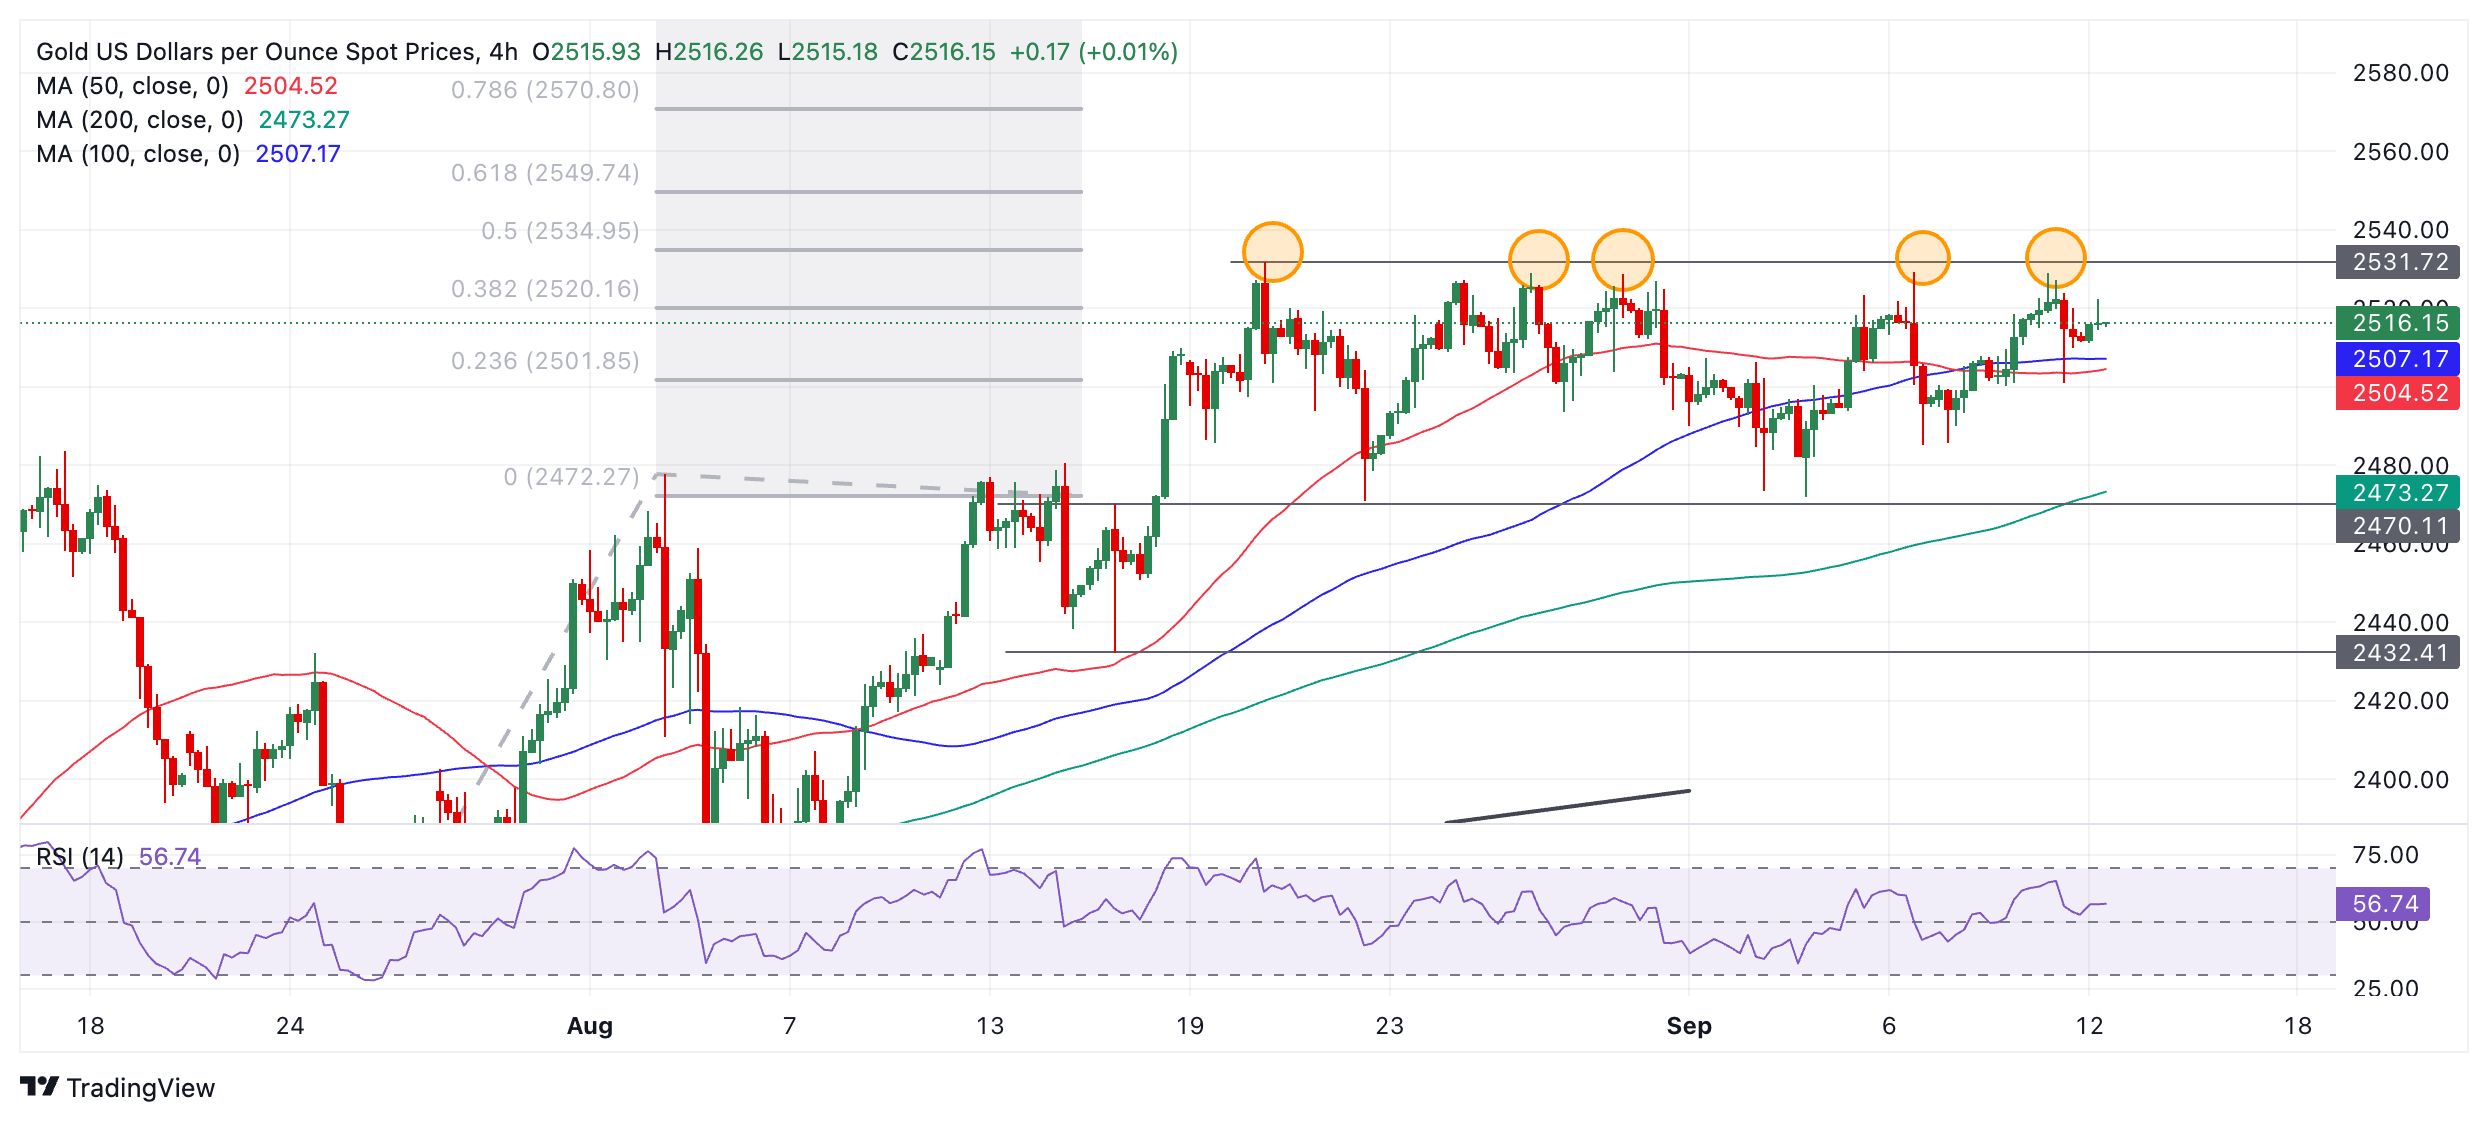
Technical Analysis: Gold makes multiple touches to top-of-range
Gold (XAU/USD) trades back in the middle of its multi-week sideways range after briefly retesting the all-time high of $2,531 on Wednesday.
As seen from the chart below, Gold price has tested the ceiling of the range on multiple occasions (orange-shaded circles) and, according to technical analysis theory, this suggests that if it does eventually break through, the move will be volatile.
XAU/USD 4-hour Chart
The longer-term trend for Gold is bullish, and since “the trend is your friend,” this increases the odds of an eventual breakout higher materializing.
The precious metal has an as-yet unreached bullish target at $2,550, generated after the original breakout from the July-August range on August 14. If Gold breaks above the range highs, it will probably rapidly reach its goal.
A break above the August 20 all-time high of $2,531 would provide more confirmation of a continuation higher toward the $2,550 target.
The short-term trend is now sideways, however, so it is also quite possible the yellow metal will continue trading up and down within its multi-week range between the $2,480s and the $2,531 record high.
If Gold closes below $2,460 it would change the picture and bring the bullish bias into question.
Economic Indicator
Producer Price Index (YoY)
The Producer Price Index released by the Bureau of Labor statistics, Department of Labor measures the average changes in prices in primary markets of the US by producers of commodities in all states of processing. Changes in the PPI are widely followed as an indicator of commodity inflation. Generally speaking, a high reading is seen as positive (or bullish) for the USD, whereas a low reading is seen as negative (or bearish).
Read more.Next release: Thu Sep 12, 2024 12:30
Frequency: Monthly
Consensus: 1.8%
Previous: 2.2%
Source: US Bureau of Labor Statistics
Recommended Articles


