

Silver Price Prediction: Rising to mini-range highs, aided by bullish momentum

Source Fxstreet
  • Silver is unfolding a bullish leg within a range. 
  • Upside is helped by bullish convergence between price and momentum. 

Silver (XAG/USD) is trading inside a broad range that stretches from the $26s to the $30s. Within that range it is oscillating within the confines of a smaller consolidation between roughly $27.70 and $29.20. 

Silver 4-hour Chart 
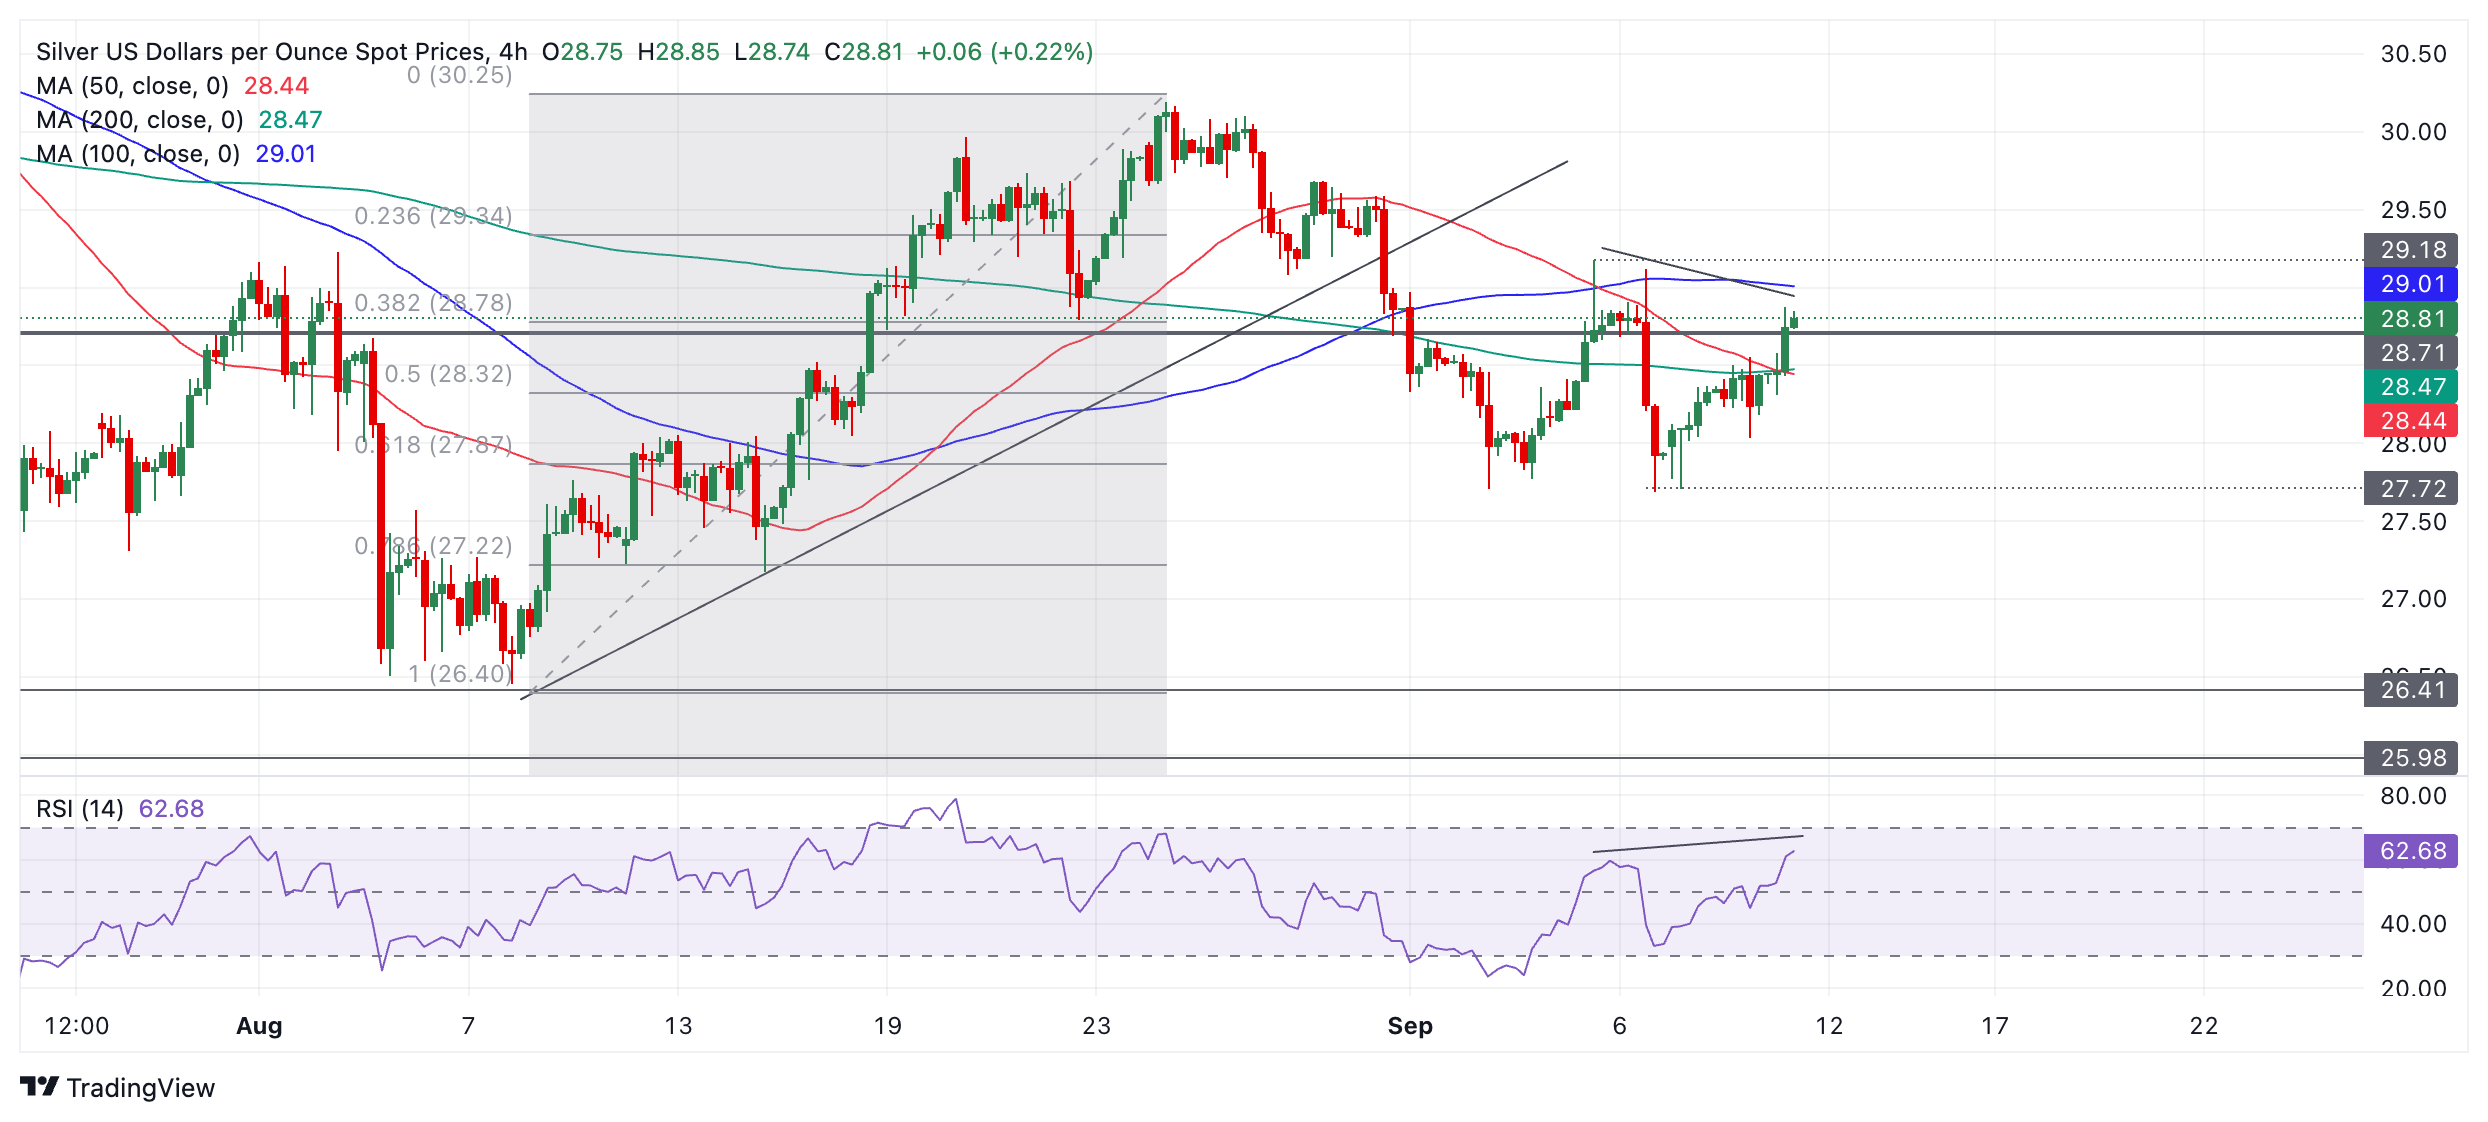
Silver is currently trading in the $28.80s as it unfolds an up leg towards the ceiling of the mini range. It will probably continue higher until it reaches about $29.18 (September 5 high). 

The up move from the September 6 swing low is accompanied by a bullish convergence with the Relative Strength Index (RSI) momentum indicator. The price is lower than it was on September 5 but the RSI is higher. This indicates the current up leg is accompanied by bullish conviction.   

After it reaches the top of this mini-range there is a possibility it could rotate and start moving back down towards the $27.70 floor. 

Alternatively a decisive break higher would indicate a bullish continuation. Such a move would probably reach about $30.10 and the ceiling of the broader range. The target is calculated by taking the 0.618 Fibonacci extension of the height of the smaller range and extrapolating it higher, which is the standard technical method for forecasting a range breakout.


Disclaimer: For information purposes only. Past performance is not indicative of future results.
placeholder
Financial Markets 2026: Volatility Catalysts in Gold, Silver, Oil, and Blue-Chip Stocks—A CFD Trader's OutlookGet a comprehensive financial market 2026 outlook exploring key economic drivers, volatility catalysts in gold, oil and stocks, and what the evolving economic outlook means for cfd trading strategies and risk management on global markets.
Author  Rachel Weiss
May 15, Fri
Get a comprehensive financial market 2026 outlook exploring key economic drivers, volatility catalysts in gold, oil and stocks, and what the evolving economic outlook means for cfd trading strategies and risk management on global markets.
placeholder
Japanese Yen rallies to February 18 high as upbeat wage data and GDP lift BoJ hike betsThe USD/JPY pair declines for the second straight day – also marking the fourth day of a fall in the previous five – and sinks to its lowest level since February 18, around mid-153.00s during the Asian session on Tuesday.
Author  FXStreet
Sep 08, Tue
The USD/JPY pair declines for the second straight day – also marking the fourth day of a fall in the previous five – and sinks to its lowest level since February 18, around mid-153.00s during the Asian session on Tuesday.
placeholder
Brent holds above $100 as tanker attacks tighten supply — but four forces are capping the rallyBrent crude is holding above $100 a barrel for a second session, its first close above the level since late July, as tanker attacks near the Strait of Hormuz squeeze an already tight physical market. Yet the rally has been gradual: 8.3 mb/d of Gulf output is still shut in, diesel is at a record, and forecasts now range from $74 to $100.
Author  Irene Q.
Sep 10, Thu
Brent crude is holding above $100 a barrel for a second session, its first close above the level since late July, as tanker attacks near the Strait of Hormuz squeeze an already tight physical market. Yet the rally has been gradual: 8.3 mb/d of Gulf output is still shut in, diesel is at a record, and forecasts now range from $74 to $100.
placeholder
US August CPI lands tonight: after a 5.4% PPI shock, will the Fed hike on September 16?US August PPI came in at 5.4% year-on-year, above the 5.3% consensus, with core PPI at 4.6%. Traders have pushed the odds of a 25bp Fed hike on September 15-16 to around 70%. Tonight's CPI is the last major inflation print before the decision — here is the full calendar, the consensus numbers, and what a hot versus cool reading would mean for the dollar, yields, gold and stocks.
Author  Irene Q.
Sep 11, Fri
US August PPI came in at 5.4% year-on-year, above the 5.3% consensus, with core PPI at 4.6%. Traders have pushed the odds of a 25bp Fed hike on September 15-16 to around 70%. Tonight's CPI is the last major inflation print before the decision — here is the full calendar, the consensus numbers, and what a hot versus cool reading would mean for the dollar, yields, gold and stocks.
placeholder
Gold Price Forecast: PPI and Oil Prices Fuel Inflation Concerns, Can CPI Change Gold's Direction?As of the Asian session on September 11, gold prices (XAUUSD) remained in weak consolidation today after dropping sharply to near $4,300 on Thursday, with the latest price trading around
Author  TradingKey
Sep 11, Fri
As of the Asian session on September 11, gold prices (XAUUSD) remained in weak consolidation today after dropping sharply to near $4,300 on Thursday, with the latest price trading around
Related Instrument
goTop
quote