

Silver Price Forecast: XAG/USD seems vulnerable near $27.70-65 confluence hurdle breakpoint
- Silver comes under renewed selling pressure and erodes a part of the overnight strong gains.
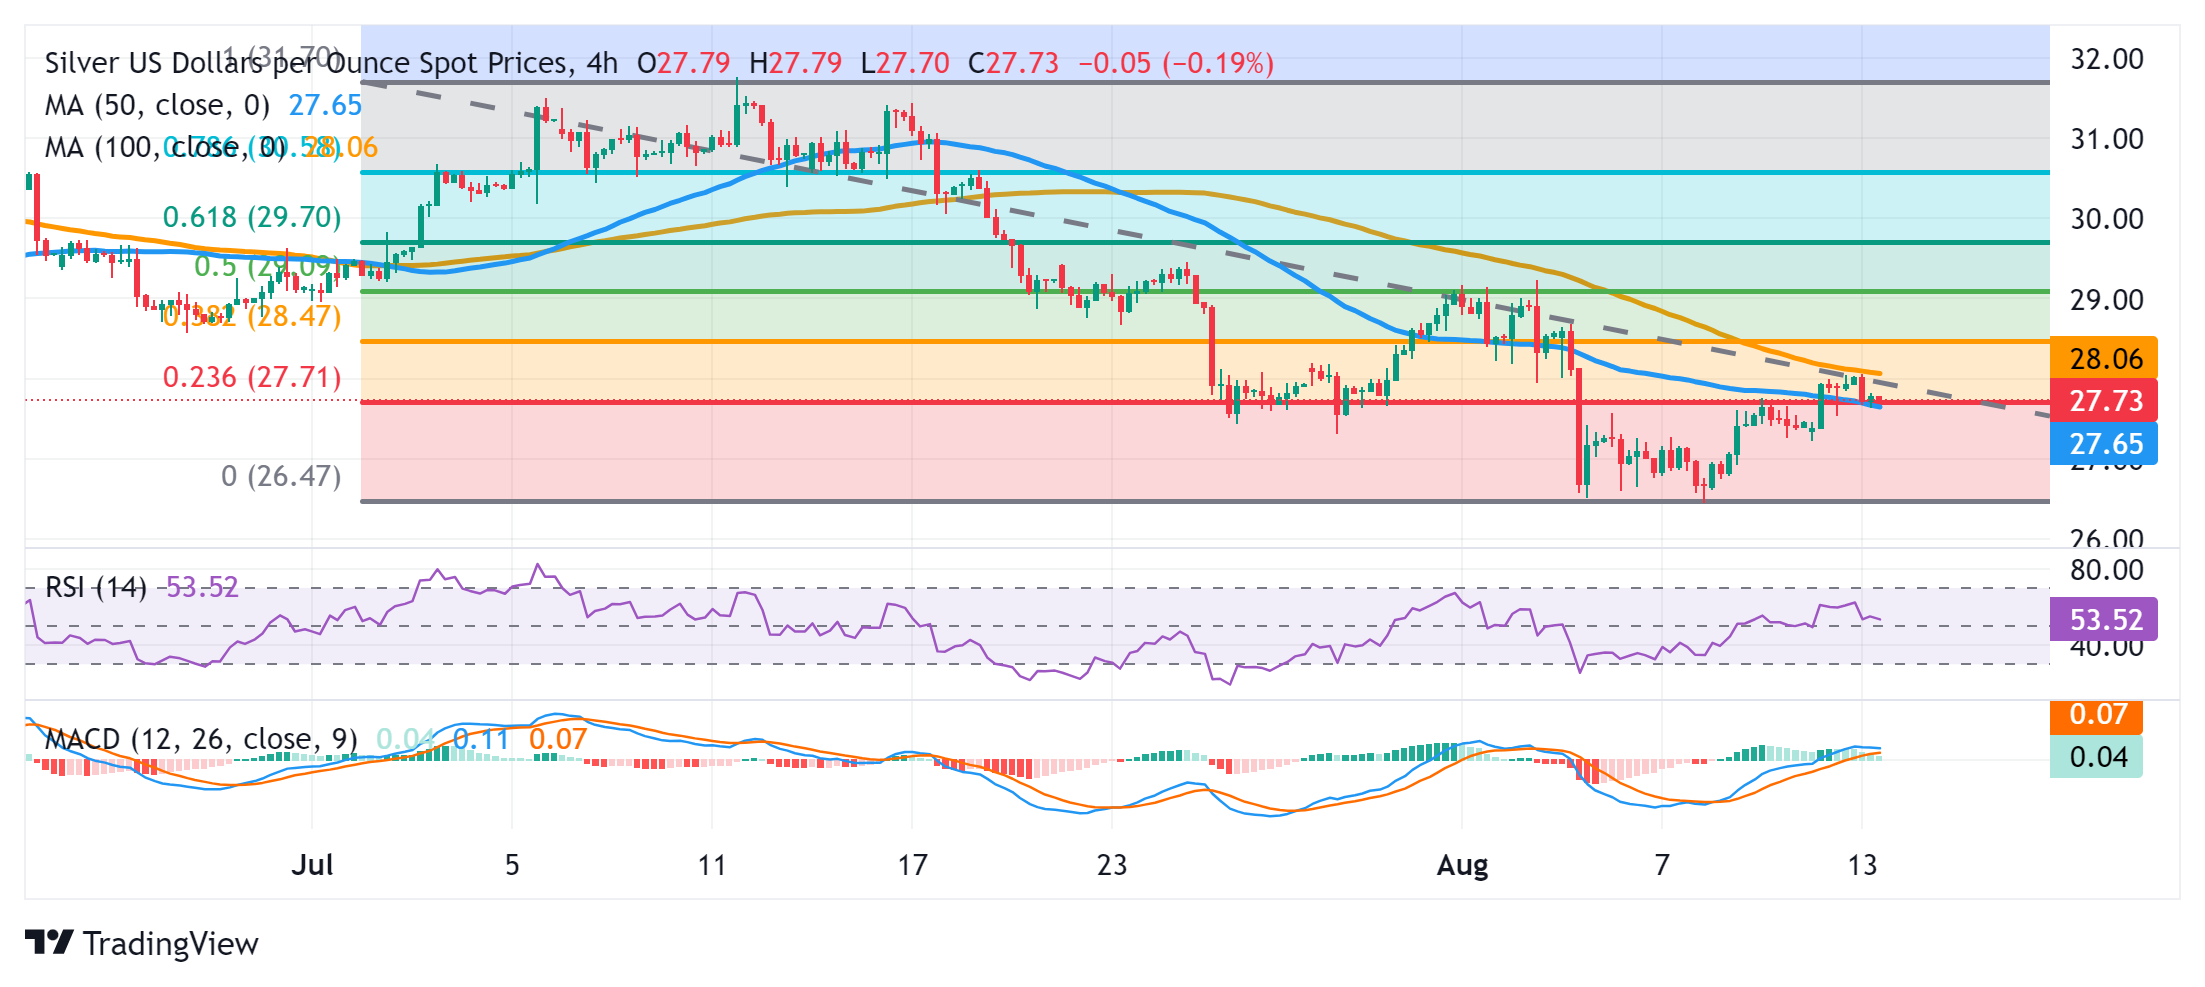
- A move beyond the 100-period SMA on the 4-hour chart will pave the way for further gains.
- The technical setup on the daily chart warrants some caution for aggressive bullish traders.
Silver (XAG/USD) struggles to capitalize on the previous day's strong move up beyond the $28.00 round-figure mark and meets with some supply on Tuesday. The white metal maintains its offered tone through the early part of the European session and currently trades around the $27.75 region, down nearly 1% for the day.
From a technical perspective, the intraday break through a confluence hurdle comprising the 50-period Simple Moving Average (SMA) on the 4-hour chart and the 23.6% Fibonacci retracement level of the July-August fall favors bullish traders. Adding to this, oscillators on the said chart have just started gaining positive traction and support prospects for further gains. That said, failure near the 100-period SMA resistance warrants some caution.
Meanwhile, oscillators on the daily chart – though have recovered from lower levels – are still holding in negative territory. This further makes it prudent to wait for sustained strength and acceptance above the $28.00 mark, or the 100-period SMA on the 4-hour chart, before placing fresh bullish bets. The XAG/USD might then climb to 38.2% Fibo. level, around the $28.45 region, en route to the $29.00 mark, which coincides with the 50% Fibo. level.
On the flip side, any further decline is likely to find some support near the $27.35 horizontal zone, below which the XAG/USD could accelerate the fall towards the $27.00 mark. The downward trajectory could extend further towards a three-month low, around the $26.40-$26.35 region touched last week, en route to the $26.00 round figure mark.
Silver 4-hour chart
Silver FAQs
Silver is a precious metal highly traded among investors. It has been historically used as a store of value and a medium of exchange. Although less popular than Gold, traders may turn to Silver to diversify their investment portfolio, for its intrinsic value or as a potential hedge during high-inflation periods. Investors can buy physical Silver, in coins or in bars, or trade it through vehicles such as Exchange Traded Funds, which track its price on international markets.
Silver prices can move due to a wide range of factors. Geopolitical instability or fears of a deep recession can make Silver price escalate due to its safe-haven status, although to a lesser extent than Gold's. As a yieldless asset, Silver tends to rise with lower interest rates. Its moves also depend on how the US Dollar (USD) behaves as the asset is priced in dollars (XAG/USD). A strong Dollar tends to keep the price of Silver at bay, whereas a weaker Dollar is likely to propel prices up. Other factors such as investment demand, mining supply – Silver is much more abundant than Gold – and recycling rates can also affect prices.
Silver is widely used in industry, particularly in sectors such as electronics or solar energy, as it has one of the highest electric conductivity of all metals – more than Copper and Gold. A surge in demand can increase prices, while a decline tends to lower them. Dynamics in the US, Chinese and Indian economies can also contribute to price swings: for the US and particularly China, their big industrial sectors use Silver in various processes; in India, consumers’ demand for the precious metal for jewellery also plays a key role in setting prices.
Silver prices tend to follow Gold's moves. When Gold prices rise, Silver typically follows suit, as their status as safe-haven assets is similar. The Gold/Silver ratio, which shows the number of ounces of Silver needed to equal the value of one ounce of Gold, may help to determine the relative valuation between both metals. Some investors may consider a high ratio as an indicator that Silver is undervalued, or Gold is overvalued. On the contrary, a low ratio might suggest that Gold is undervalued relative to Silver.
Recommended Articles


