

Gold rallies after the Fed Chairman has spoken

Source Fxstreet
  • Gold is rallying after the Chairman of the Fed Jerome Powell said good progress was being made on inflation. 
  • His statements suggest a good chance the Fed will cut interest rates in the short term. 
  • Market-based probabilities are now showing a 100% chance of the Fed cutting interest rates at the September meeting. 

Gold (XAU/USD) is up over half a percent on Tuesday, trading in the $2,440s as it inches up toward the $2,451 all-time high. The rally in the yellow metal is being supported by heightened expectations that the Federal Reserve (Fed) will cut interest rates at their meeting in September as inflation continues to show signs of cooling.  

The firmer expectations that interest rates will be lowered contrast with the Fed’s previous non-committal, ambiguous stance. Lower interest rates are positive for Gold because they lower the opportunity cost of holding the non-interest-bearing asset. 

Gold rises after Fed Chairman Powell indicates cuts are on their way

Gold is rising after Fed Chairman Jerome Powell commented in a speech on Monday on how inflation was showing promising signs of progress toward the central bank’s target and hinted that cuts to interest rates were on their way. His comments led to a dramatic recalibration of market-based expectations for the trajectory of the Fed Funds rate, the Fed’s key monetary policy rate. 

The CME FedWatch tool, which uses the price of 30-day Fed Funds futures to calculate probabilities of future rate changes, is now pricing in a 100% chance of at least a 0.25% cut in the Fed Funds rate to an upper band of 5.25% when the Fed meets in September. Prior to the Chairman’s comments, the probabilities had been hovering just above the 60% mark. 

The change in outlook comes after US inflation data in the form of the Consumer Price Index (CPI) undershot expectations in June – falling to 3.0%. Before that,both headline and core Personal Consumption Expenditure (PCE) inflation data – the Fed’s preferred gauge – fell to 2.6% in May, also undershooting expectations. 

Technical Analysis: Gold continues rising within a range

Gold is rising within a range, and it is approaching its May 20 all-time high. 

The precious metal is probably in a sideways consolidation – a pause within a broader uptrend. 

XAU/USD Daily Chart
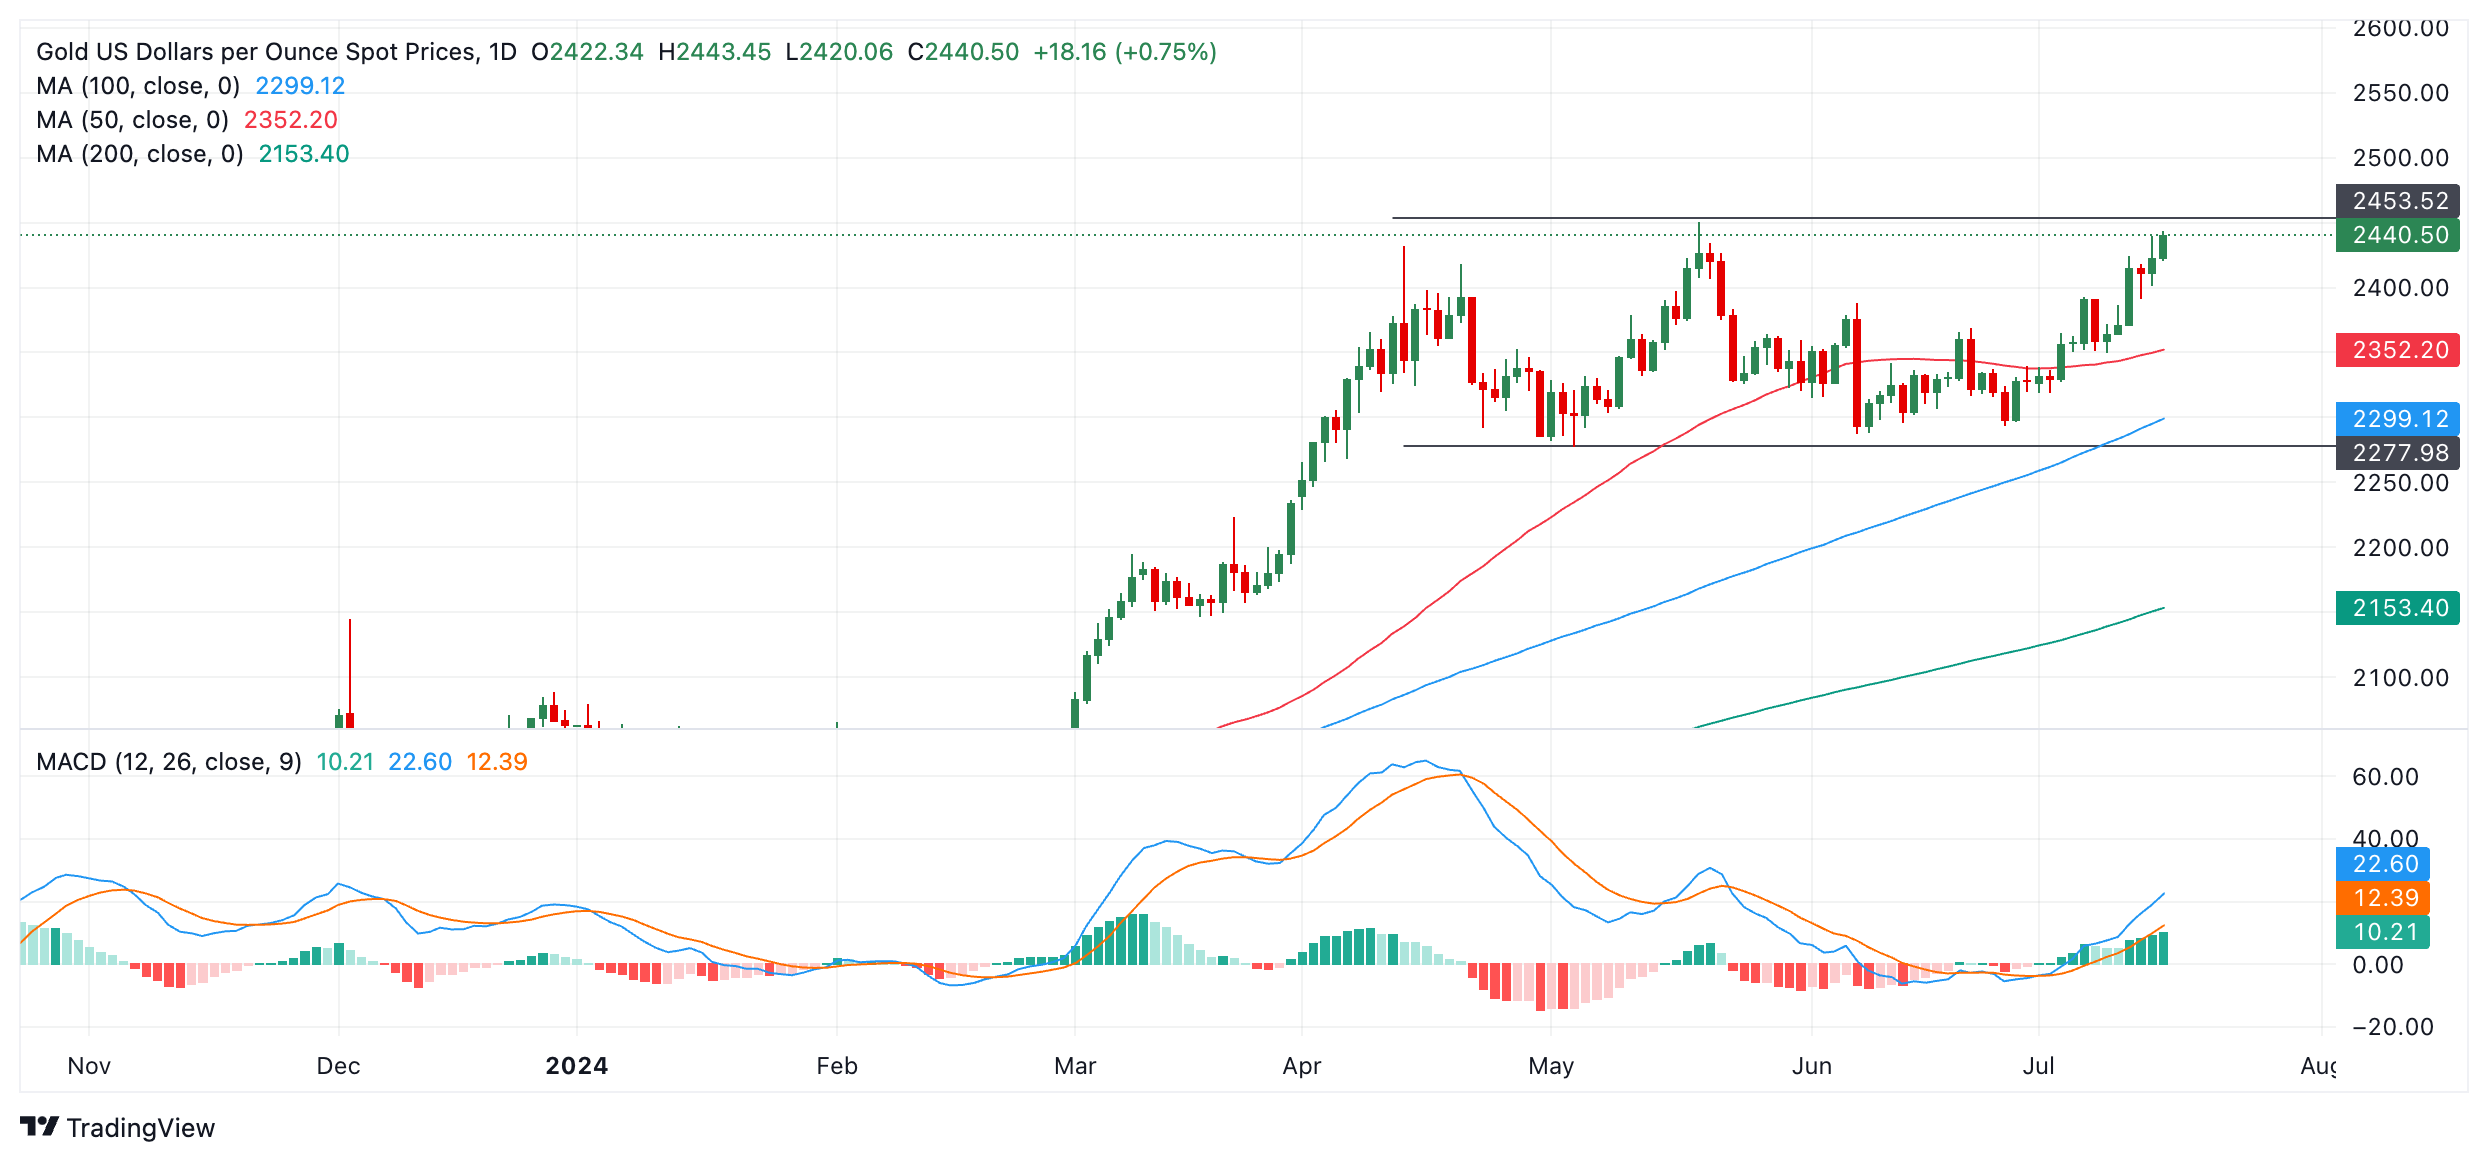
On a short-term basis, Gold could now be in a sideways trend as it extends a leg higher within the range that has unfolded since April. The sideways trend has a floor at roughly $2,280 and a ceiling at $2,451. 

Since breaking above the June 7 peak of $2,388, the precious metal has received bullish confirmation, unlocking the next upside target at the $2,451 all-time high. 

In the long term, Gold remains in an uptrend, suggesting odds favor an eventual breakout to the upside of the range. 

A decisive break above the $2,451 high – which is also the range ceiling – would unlock a target at $2,555, calculated by extrapolating the 0.618 Fibonacci ratio of the height of the range higher.

Economic Indicator

Fed's Chair Powell speech

Jerome H. Powell took office as a member of the Board of Governors of the Federal Reserve System on May 25, 2012, to fill an unexpired term. On November 2, 2017, President Donald Trump nominated Powell to serve as the next Chairman of the Federal Reserve. Powell assumed office as Chair on February 5, 2018.

Read more.

Last release: Mon Jul 15, 2024 16:30

Frequency: Irregular

Actual: -

Consensus: -

Previous: -

Source: Federal Reserve


Disclaimer: For information purposes only. Past performance is not indicative of future results.
placeholder
Gold Price Analysis Today | Forex Gold Analysis | XAU/USD Analysis - November 11, 2026Get the latest gold price analysis, forex gold insights, and XAU/USD analysis for November 11, 2026. Read on for the details.
Author  Mitrade
Nov 11, Wed
Get the latest gold price analysis, forex gold insights, and XAU/USD analysis for November 11, 2026. Read on for the details.
placeholder
Bitcoin lost its 200-day average — but the exit started three sessions before the CPIBitcoin fell 2.5% to about $73,400 on 11 November, an 11-week low, breaking its 200-day moving average near $73,100. The 24-hour liquidation tally reached $632 to $705 million, roughly 82% of it longs. But spot ETF outflows began three sessions earlier and USDT's market cap has shrunk $6.6 billion in 60 days — the leveraged length left before the inflation print did. A double top at 81,890 and 81,080 leaves a measured target of 69,366.
Author  Suzie
Nov 11, Wed
Bitcoin fell 2.5% to about $73,400 on 11 November, an 11-week low, breaking its 200-day moving average near $73,100. The 24-hour liquidation tally reached $632 to $705 million, roughly 82% of it longs. But spot ETF outflows began three sessions earlier and USDT's market cap has shrunk $6.6 billion in 60 days — the leveraged length left before the inflation print did. A double top at 81,890 and 81,080 leaves a measured target of 69,366.
placeholder
Nvidia slid 7.7% after hours while AMD and Broadcom rose — the AI trade changed hands, it didn't breakNvidia closed Wednesday at 173.73, up 2.87%, then fell as much as 8.1% to 159.44 after reports that its board was preparing for a possible leadership change. The same session, the Philadelphia Semiconductor Index rose 5.7% with all 30 components higher, CoreWeave jumped 24.7% on 168% revenue growth, and Micron added 11.9%. If AI demand were being repriced, AMD and Broadcom would not be bid. This is a governance discount on one name, and 204.54 — the 200-day average — is the level that settles it.
Author  Irene Q.
Nov 12, Thu
Nvidia closed Wednesday at 173.73, up 2.87%, then fell as much as 8.1% to 159.44 after reports that its board was preparing for a possible leadership change. The same session, the Philadelphia Semiconductor Index rose 5.7% with all 30 components higher, CoreWeave jumped 24.7% on 168% revenue growth, and Micron added 11.9%. If AI demand were being repriced, AMD and Broadcom would not be bid. This is a governance discount on one name, and 204.54 — the 200-day average — is the level that settles it.
placeholder
Gold hit a one-year low while central banks bought 321 tonnes — the sellers were never the ones you thinkSpot gold closed at 3,876 on Thursday, down 2.8% and its lowest close in more than a year, with an intraday low near 3,852. The dollar is at a 19-month high of 103.21 and the 10-year yield is at 5.10%, so the price move is easy to explain. What is harder to explain is who sold: central banks bought 321 tonnes in Q3, the PBoC added for a 24th straight month, ETF holdings are near a record 4,256 tonnes, and roughly 95% of the futures selling came from non-reportable and sovereign-type accounts rather than hedge funds. This piece separates the two books that have to balance.
Author  Irene Q.
Yesterday 02: 40
Spot gold closed at 3,876 on Thursday, down 2.8% and its lowest close in more than a year, with an intraday low near 3,852. The dollar is at a 19-month high of 103.21 and the 10-year yield is at 5.10%, so the price move is easy to explain. What is harder to explain is who sold: central banks bought 321 tonnes in Q3, the PBoC added for a 24th straight month, ETF holdings are near a record 4,256 tonnes, and roughly 95% of the futures selling came from non-reportable and sovereign-type accounts rather than hedge funds. This piece separates the two books that have to balance.
placeholder
Brent rose 3.3% and US crude stocks built 4.66 million barrels in the same weekBrent January settled at 95.82, up 3.3%, and WTI at 88.74, up 2.55%, after the US signalled it would not pursue a deal with Iran and attacks on Gulf shipping continued. In the same week, EIA data showed US crude inventories rising 4.657 million barrels against expectations of a 1.1 million draw, with gasoline up another 1.799 million. OPEC output also rebounded 1.96 million barrels a day to 27.16 million in October, led by Saudi Arabia at 10.56 million. This piece separates the geopolitical premium from the physical balance and lays out where each side of the trade is anchored.
Author  Irene Q.
Yesterday 03: 06
Brent January settled at 95.82, up 3.3%, and WTI at 88.74, up 2.55%, after the US signalled it would not pursue a deal with Iran and attacks on Gulf shipping continued. In the same week, EIA data showed US crude inventories rising 4.657 million barrels against expectations of a 1.1 million draw, with gasoline up another 1.799 million. OPEC output also rebounded 1.96 million barrels a day to 27.16 million in October, led by Saudi Arabia at 10.56 million. This piece separates the geopolitical premium from the physical balance and lays out where each side of the trade is anchored.
Related Instrument
goTop
quote