Silver Price Forecast: XAG/USD struggles amid strong US data, Fed’s caution stance

Source Fxstreet
  • Silver price down 1.58%, nearing $22.50, amid strong US Retail Sales and Industrial Production data.
  • Waller's comments on cautious rate cuts prompt market to rethink Fed easing expectations."
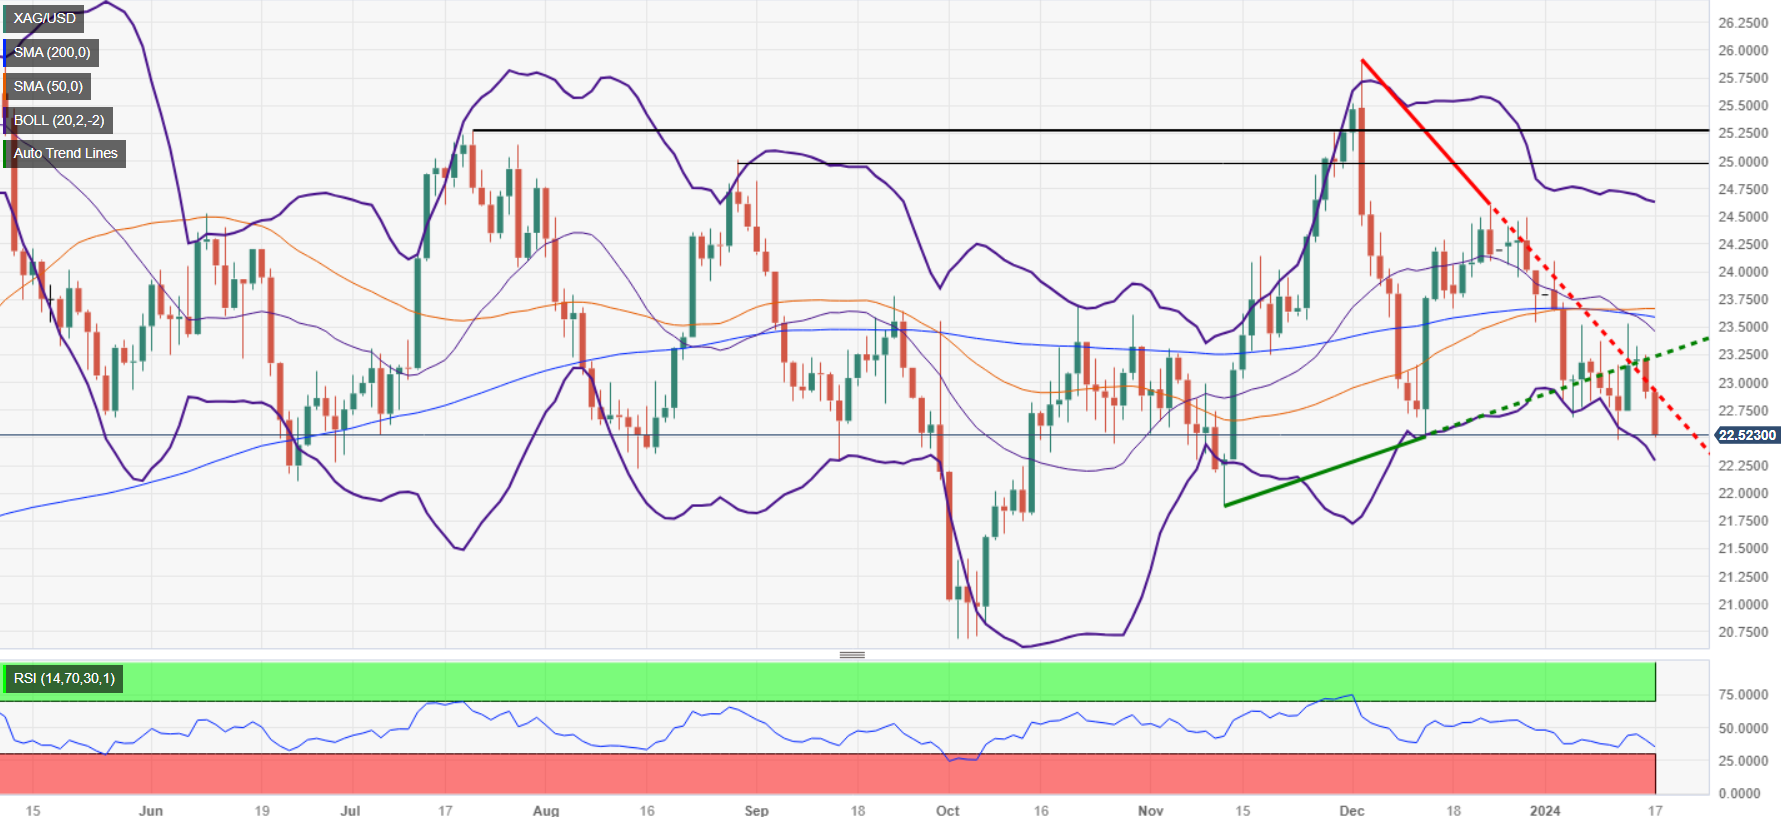
  • Technical outlook: Further silver price decline possible, with focus on $22.00 and $21.88; $23.00 critical for recovery.

Silver price stays depressed for the second straight day, though it appears to have bottomed at around the $22.50 area for the third occasion during the last couple of months, as it loses 1.58% after hitting a daily high of $22.94.

XAG/USD falters, bottoms at around $22.50 as investors adjust Fed rate cut trajectory

Fundamentally speaking, solid economic data from the United States (US) bolstered the Greenback (USD) as US Treasury yields resumed to the upside. Retail Sales for December rose by 0.6%, exceeding forecasts of a 0.4% jump and November’s reading. Lately, the US Federal Reserve announced that Industrial Production improved modestly by 0.1%, after contracting and stagnating in October and November of last year.

Meanwhile, Fed officials continued to push back against aggressive rate cuts, even though most of them see at least three rate cuts, as portrayed by December’s Summary of Economic Projections (SEP). Yesterday’s comments of Fed Governor Christopher Waller, who said that he supports rate cuts but added the US central bank is in no rush to relax policy. That sparked a reaction on bets that the Fed would ease policy faster than expected, as seen with investors trimming odds from 175 basis points of rate cuts at the beginning of the week to 148.

XAG/USD Price Analysis: Technical outlook

Therefore, further Silver’s weakness is expected, though sellers must push prices below $22.50. A breach of that level will expose the $22.00 a troy ounce figure, followed by the November 13 swing low of $21.88. Further downside is seen at the October 3 low of $20.69. Contrarily, if buyers regain $23.00, that could pav the way for challenging the 100-day moving average (DMA) at $23.20.

XAG/USD Technical Levels


Disclaimer: For information purposes only. Past performance is not indicative of future results.
placeholder
The 2026 Fed Consensus Debate: Not Hassett, It’s About Whether Powell Stays or GoesKevin Hassett, White House National Economic Council Director, is poised to succeed Jerome Powell as the next Federal Reserve Chair. This development signals a potentially more dovish mon
Author  TradingKey
9 hours ago
Kevin Hassett, White House National Economic Council Director, is poised to succeed Jerome Powell as the next Federal Reserve Chair. This development signals a potentially more dovish mon
placeholder
Avalanche Bulls Eye Trend Reversal, Though Muted Derivatives Signal CautionAvalanche (AVAX) consolidates above $14.00 after an 8% breakout, but with open interest below $600 million and key resistance at $17.14 looming, traders remain cautious.
Author  Mitrade
12 hours ago
Avalanche (AVAX) consolidates above $14.00 after an 8% breakout, but with open interest below $600 million and key resistance at $17.14 looming, traders remain cautious.
placeholder
Bitcoin Bollinger Bands indicate another 'parabolic' bull signal like late 2023Historical patterns indicate that low BandWidth levels often precede significant BTC price increases.
Author  Mitrade
13 hours ago
Historical patterns indicate that low BandWidth levels often precede significant BTC price increases.
placeholder
AUD/USD sticks to gains above 0.6600, highest since late October after Aussie trade dataThe AUD/USD pair prolongs its strong uptrend witnessed over the past two weeks or so and advances to a fresh high since late October during the Asian session on Thursday.
Author  FXStreet
18 hours ago
The AUD/USD pair prolongs its strong uptrend witnessed over the past two weeks or so and advances to a fresh high since late October during the Asian session on Thursday.
placeholder
Solana Price Forecast: ETF Demand and Derivatives Flows Fuel a Sharper ReboundSolana (SOL) trades above $140 after a 10% daily jump, as ETF inflows flip positive, futures open interest climbs 6.75% and on-chain TVL and stablecoin liquidity rise, setting up a potential double-bottom breakout toward the 50-day EMA at $158 if SOL can secure a daily close above $145.
Author  Mitrade
Yesterday 06: 36
Solana (SOL) trades above $140 after a 10% daily jump, as ETF inflows flip positive, futures open interest climbs 6.75% and on-chain TVL and stablecoin liquidity rise, setting up a potential double-bottom breakout toward the 50-day EMA at $158 if SOL can secure a daily close above $145.
goTop
quote