


Oil holds up near six-week high on escalating tensions, supply woes
- Oil prices edge down slightly on Tuesday after Monday’s rally.
- Traders see pressure building with Pemex limiting refining activities again and geopolitical tensions spiraling.
- The US Dollar Index trades above 105.00, with European equities triggering a risk-off market mood.
Oil prices ease a touch on Tuesday but remain close to a six-week high after their firm uptick on Monday. Prices moved higher driven by increasing geopolitical tensions from Russia to Yemen, while supply issues in the US are also mounting. With parts of Texas reopening again after a tropical depression hit the Oil-producing region, one of the biggest refiners in the US, Pemex, said it is limiting its volumes again. Back in April, the firm faced a fire that damaged the installations, and now another plant has been forced to limit production due to a breach of air quality in the region.
Meanwhile, the US Dollar Index (DXY), which tracks the performance of the US Dollar against six major currencies, is on the front foot after a sluggish start on Monday. The Greenback benefits from a risk-off market mood on Tuesday, with Nvidia in the US and Airbus in Europe facing substantial losses, dragging major indices down.
At the time of writing, Crude Oil (WTI) trades at $81.32 and Brent Crude at $85.05.
Oil news and market movers: Pemex in the balance
- Pemex, one of the biggest refiners in the US, has cut its production in two separate plants, Bloomberg reports:
- One refinery still sees production hiccups due to a fire back in April.
- A second refinery was forced to reduce its productivity due to air quality limitations .
- Indian state-owned refiners are in talks with Russia for Ural Oil deliveries at a discounted price of around $3 to $5 below current benchmark prices after Reliance Industries Ltd. struck a deal earlier with Moscow, according to Reuters.
- The American Petroleum Institute (API) will release its weekly figures on Tuesday at 20:30 GMT. The agency reported a drawdown of 2.265 million barrels last week.
Oil Technical Analysis: Supply to get tighter
Oil prices are set to head higher before starting to ease once OPEC opens up the Oil tap again in full. The uptick will especially be felt in the US, where demand is expected to pick up as during summer a lot of citizens will be flying or driving for the holidays. Meanwhile, the hurricane season has started earlier than usual with already the first tropical depression having had impact on the Texas region.
On the upside, the red descending trend line near $81.00 has been broken and now needs to prove its resilience as support with both a daily and weekly close above it, not allowing any more false breaks. More room to move higher towards $87.12, the year-to-date high (April 5). Previously, a relatively small pivotal level would act as resistance near $84.00.
On the downside, the big belt of Simple Moving Averages (SMA) should work now as support and no longer allow to see moves below it. That means the 55-day SMA at $79.63, the 100-day SMA at $79.64, and the 200-day SMA at $78.90 should avoid any dips below $79.00. Should those levels not hold, another drop back to $75 could occur.
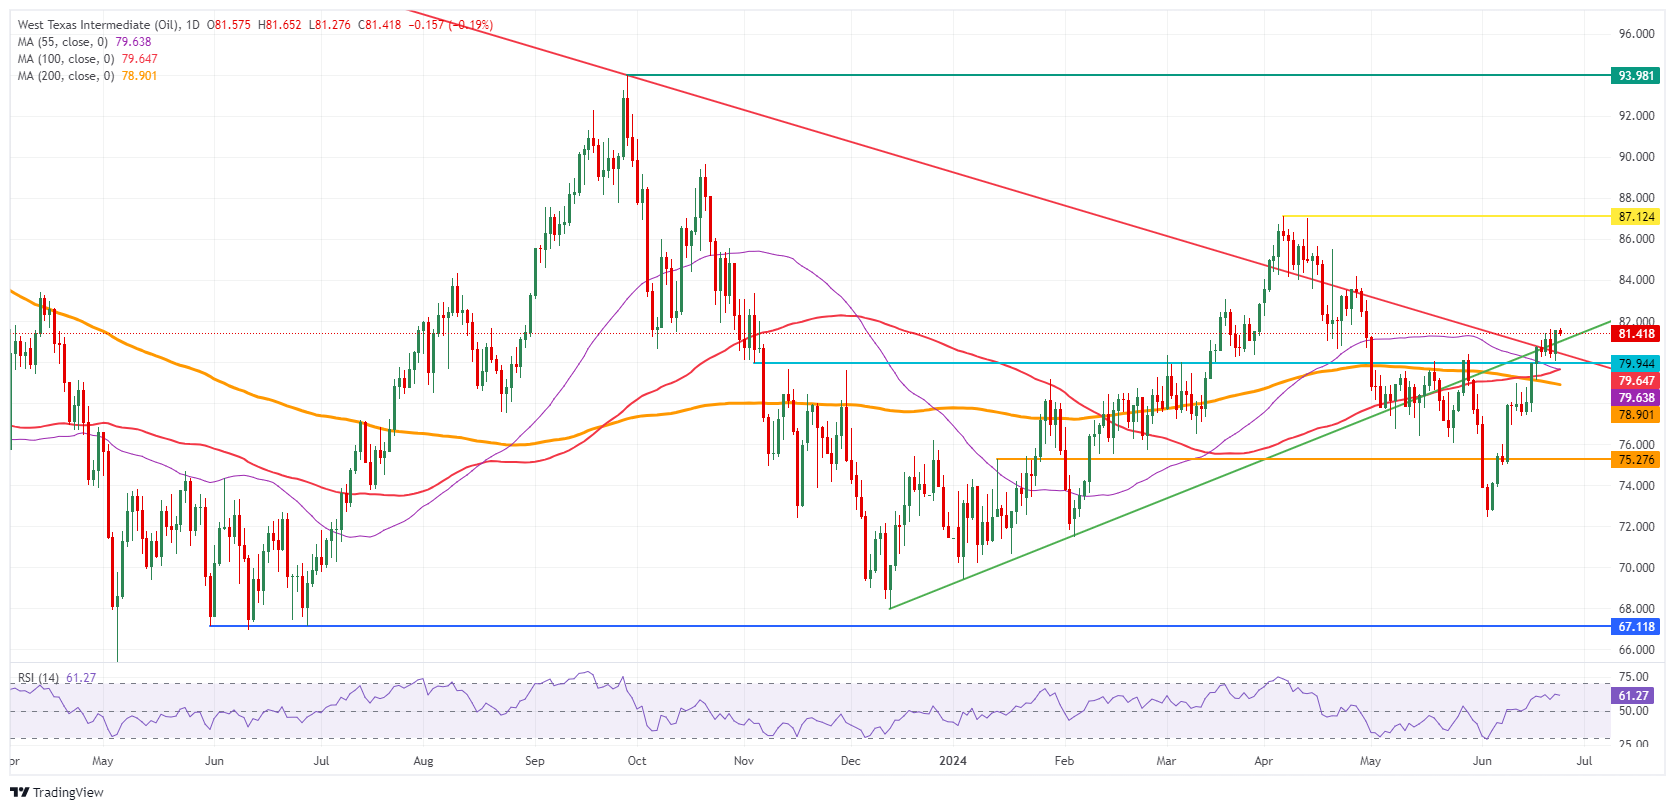
US WTI Crude Oil: Daily Chart
WTI Oil FAQs
WTI Oil is a type of Crude Oil sold on international markets. The WTI stands for West Texas Intermediate, one of three major types including Brent and Dubai Crude. WTI is also referred to as “light” and “sweet” because of its relatively low gravity and sulfur content respectively. It is considered a high quality Oil that is easily refined. It is sourced in the United States and distributed via the Cushing hub, which is considered “The Pipeline Crossroads of the World”. It is a benchmark for the Oil market and WTI price is frequently quoted in the media.
Like all assets, supply and demand are the key drivers of WTI Oil price. As such, global growth can be a driver of increased demand and vice versa for weak global growth. Political instability, wars, and sanctions can disrupt supply and impact prices. The decisions of OPEC, a group of major Oil-producing countries, is another key driver of price. The value of the US Dollar influences the price of WTI Crude Oil, since Oil is predominantly traded in US Dollars, thus a weaker US Dollar can make Oil more affordable and vice versa.
The weekly Oil inventory reports published by the American Petroleum Institute (API) and the Energy Information Agency (EIA) impact the price of WTI Oil. Changes in inventories reflect fluctuating supply and demand. If the data shows a drop in inventories it can indicate increased demand, pushing up Oil price. Higher inventories can reflect increased supply, pushing down prices. API’s report is published every Tuesday and EIA’s the day after. Their results are usually similar, falling within 1% of each other 75% of the time. The EIA data is considered more reliable, since it is a government agency.
OPEC (Organization of the Petroleum Exporting Countries) is a group of 13 Oil-producing nations who collectively decide production quotas for member countries at twice-yearly meetings. Their decisions often impact WTI Oil prices. When OPEC decides to lower quotas, it can tighten supply, pushing up Oil prices. When OPEC increases production, it has the opposite effect. OPEC refers to an expanded group that includes ten extra non-OPEC members, the most notable of which is Russia.
Recommended Articles


