Silver Price Analysis: XAG/USD stays firm and consolidates around $29.50

Source Fxstreet
  • Silver maintains gains above $29.50 for the second day, buoyed by rate cut speculation.
  • Neutral to downward bias with first support at the 50-DMA near $29.01.
  • Key resistance levels at $30.25 (June 12 high) and $31.00, with YTD high at $32.51 in sight.

Silver recovered some ground and traded above $29.50 for a second consecutive trading day, up by 0.30%. May’s US Retail Sales data disappointed investors and fueled expectations that the US central bank could cut rates this year. This weighed on US Treasury yields and the Greenback.

XAG/USD Price Analysis: Technical outlook

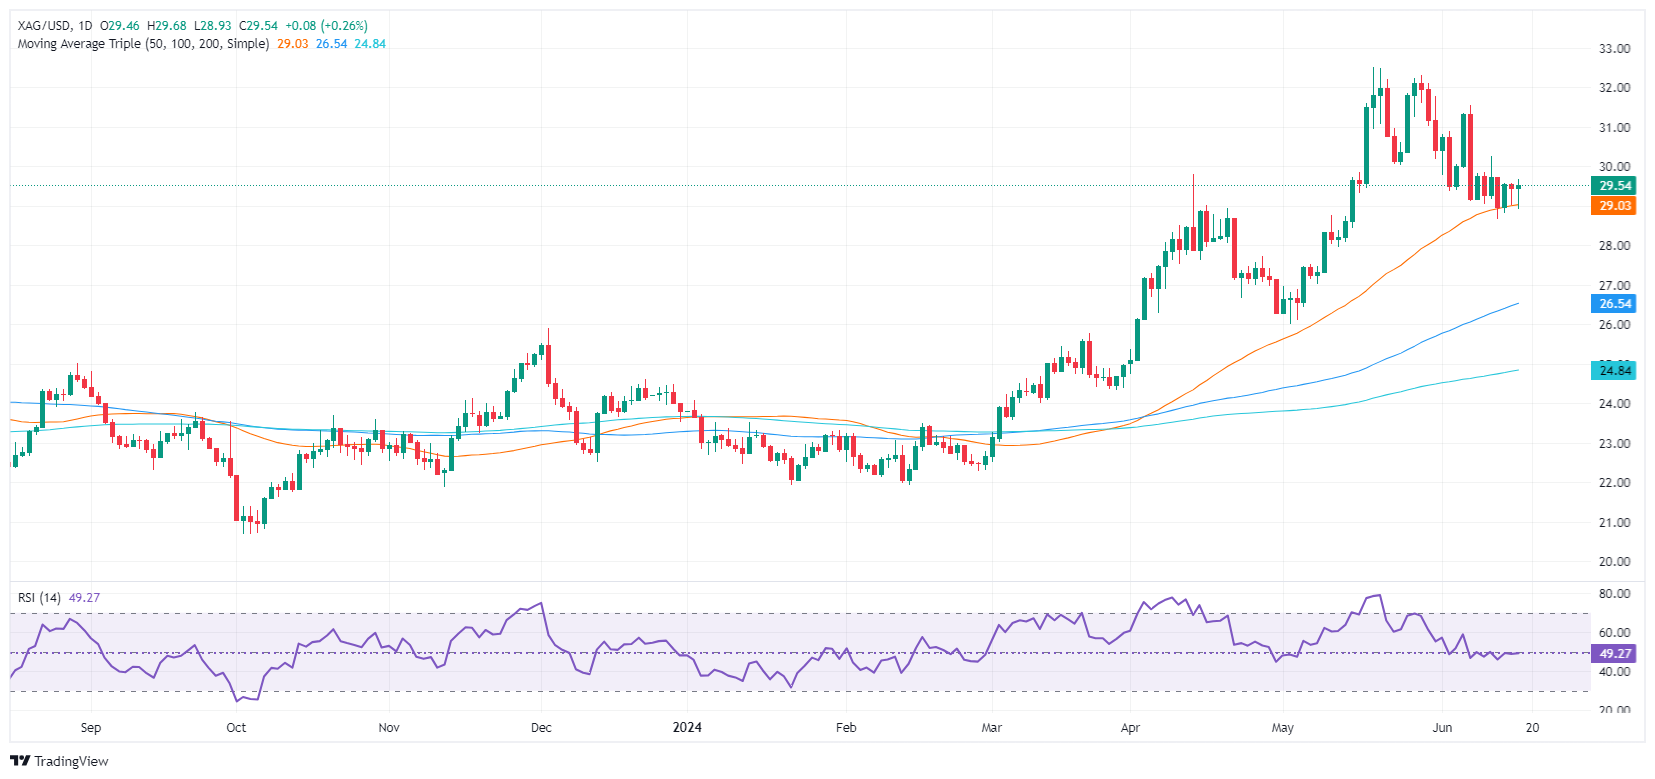
Silver’s metal is showing a neutral to downward bias after hitting an eleven-year high of $32.51. Since then, it has retreated towards the area near the 50-day moving average (DMA) at approximately $29.01, the first support level.

Momentum shows that neither buyers nor sellers remain in charge, as the Relative Strength Index (RSI) hovers at around the 50-midline.

That said, if XAG/USD rises past the $30.00 figure, the grey metal will extend its gains. The first resistance would be the June 12 high of $30.25 followed by the $31.00 mark, ahead of challenging the year-to-date (YTD) high of $32.51.

Conversely, if XAG/USD sellers keep prices below $30.00, the first support would be the 50-day moving average (DMA) at 29.01, followed by the 100-DMA at $26.40, followed by the May 2 low of $26.02.

XAG/USD Price – Daily Chart

XAG/USD

Overview
Today last price 29.54
Today Daily Change 0.08
Today Daily Change % 0.27
Today daily open 29.46
 
Trends
Daily SMA20 30.41
Daily SMA50 29
Daily SMA100 26.47
Daily SMA200 24.81
 
Levels
Previous Daily High 29.58
Previous Daily Low 29.03
Previous Weekly High 30.26
Previous Weekly Low 28.66
Previous Monthly High 32.51
Previous Monthly Low 26.02
Daily Fibonacci 38.2% 29.24
Daily Fibonacci 61.8% 29.37
Daily Pivot Point S1 29.14
Daily Pivot Point S2 28.81
Daily Pivot Point S3 28.59
Daily Pivot Point R1 29.68
Daily Pivot Point R2 29.9
Daily Pivot Point R3 30.23


Disclaimer: For information purposes only. Past performance is not indicative of future results.
placeholder
Bitcoin Price Forecast: BTC battles at key technical zone amid mixed flow signalsBitcoin (BTC) steadies around the key technical support on Tuesday after its recent correction. The Crypto King’s next directional move could hinge on this key technical zone.
Author  FXStreet
10 hours ago
Bitcoin (BTC) steadies around the key technical support on Tuesday after its recent correction. The Crypto King’s next directional move could hinge on this key technical zone.
placeholder
WTI declines below $102.00 after Trump says he called off Iran attacksWest Texas Intermediate (WTI), the US crude oil benchmark, is trading around $101.85 during the early Asian trading hours on Tuesday. The WTI price declines after US President Donald Trump said he was holding off a military attack on Iran planned for Tuesday at the request of Gulf states.
Author  FXStreet
19 hours ago
West Texas Intermediate (WTI), the US crude oil benchmark, is trading around $101.85 during the early Asian trading hours on Tuesday. The WTI price declines after US President Donald Trump said he was holding off a military attack on Iran planned for Tuesday at the request of Gulf states.
placeholder
Iran Situation Rekindles Threat of War. Bitcoin Price Decline Accelerates, $75,000 Geopolitical Defense Line Faces TestU.S.-Israel discussions on resuming strikes against Iran trigger an accelerated Bitcoin price pullback; future gains depend on whether the $75,000 support level holds.On May 18, the poten
Author  TradingKey
Yesterday 09: 03
U.S.-Israel discussions on resuming strikes against Iran trigger an accelerated Bitcoin price pullback; future gains depend on whether the $75,000 support level holds.On May 18, the poten
placeholder
Euro softens to near 1.1600 on US–Iran tensions The EUR/USD pair trades in negative territory around 1.1615 during the early Asian session on Monday. The Euro (EUR) extends the decline as the prolonged US-Iran conflict weighs on the riskier assets.
Author  FXStreet
Yesterday 01: 34
The EUR/USD pair trades in negative territory around 1.1615 during the early Asian session on Monday. The Euro (EUR) extends the decline as the prolonged US-Iran conflict weighs on the riskier assets.
placeholder
Financial Markets 2026: Volatility Catalysts in Gold, Silver, Oil, and Blue-Chip Stocks—A CFD Trader's OutlookGet a comprehensive financial market 2026 outlook exploring key economic drivers, volatility catalysts in gold, oil and stocks, and what the evolving economic outlook means for cfd trading strategies and risk management on global markets.
Author  Rachel Weiss
May 15, Fri
Get a comprehensive financial market 2026 outlook exploring key economic drivers, volatility catalysts in gold, oil and stocks, and what the evolving economic outlook means for cfd trading strategies and risk management on global markets.
Related Instrument
goTop
quote