

Crude Oil snaps higher as hopes of rising demand continue to bolster barrel bids
- WTI climbs to $80 per barrel as energy markets hope for summer demand uptick.
- Crude Oil markets shrug off disappointment Chinese demand figures.
- OPEC production limits set to expire, could swamp out Crude supplies.
West Texas Intermediate (WTI) US Crude Oil shrugged off recent bearish pressures to climb back towards the $80.00 handle on Monday. Energy markets are shrugging off the planned end of voluntary production cuts from the Organization of the Petroleum Exporting Countries (OPEC) and a miss from updated Chinese demand figures. Barrel traders continue to hope for an expected uptick in summer Crude Oil demand to stop up a possible oversupply wave that could hit barrel stocks as production continues to outpace projections.
A planned phasing out of voluntary production cuts for OPEC ally member states, OPEC , is expected to begin later in the year as OPEC begins to crack under the financial pressure of trying to prop up global Crude Oil prices. Chinese production figures also missed the mark over the weekend, threatening future hopes of an uptick in industrial fuels production. Despite headwinds on multiple fronts, Crude Oil markets are grinding out higher ground to kick off the new trading week as investors expect an uptick in summer fuel demand with a hotter-than-average summer season expected.
Crude Oil technical outlook
WTI US Crude Oil climbed back over the 200-day Exponential Moving Average (EMA) at $78.81, tipping into the touch range of the $80.00 handle as it continues an extended recovery from the recent multi-month swing low at $72.45.
A short-side play could be on the cards if bullish exhaustion runs out of gas near $80.00, but bidders could find technical support as WTI cracks above a descending trendline drawn from 2024’s peak bids above $86.00.
WTI hourly chart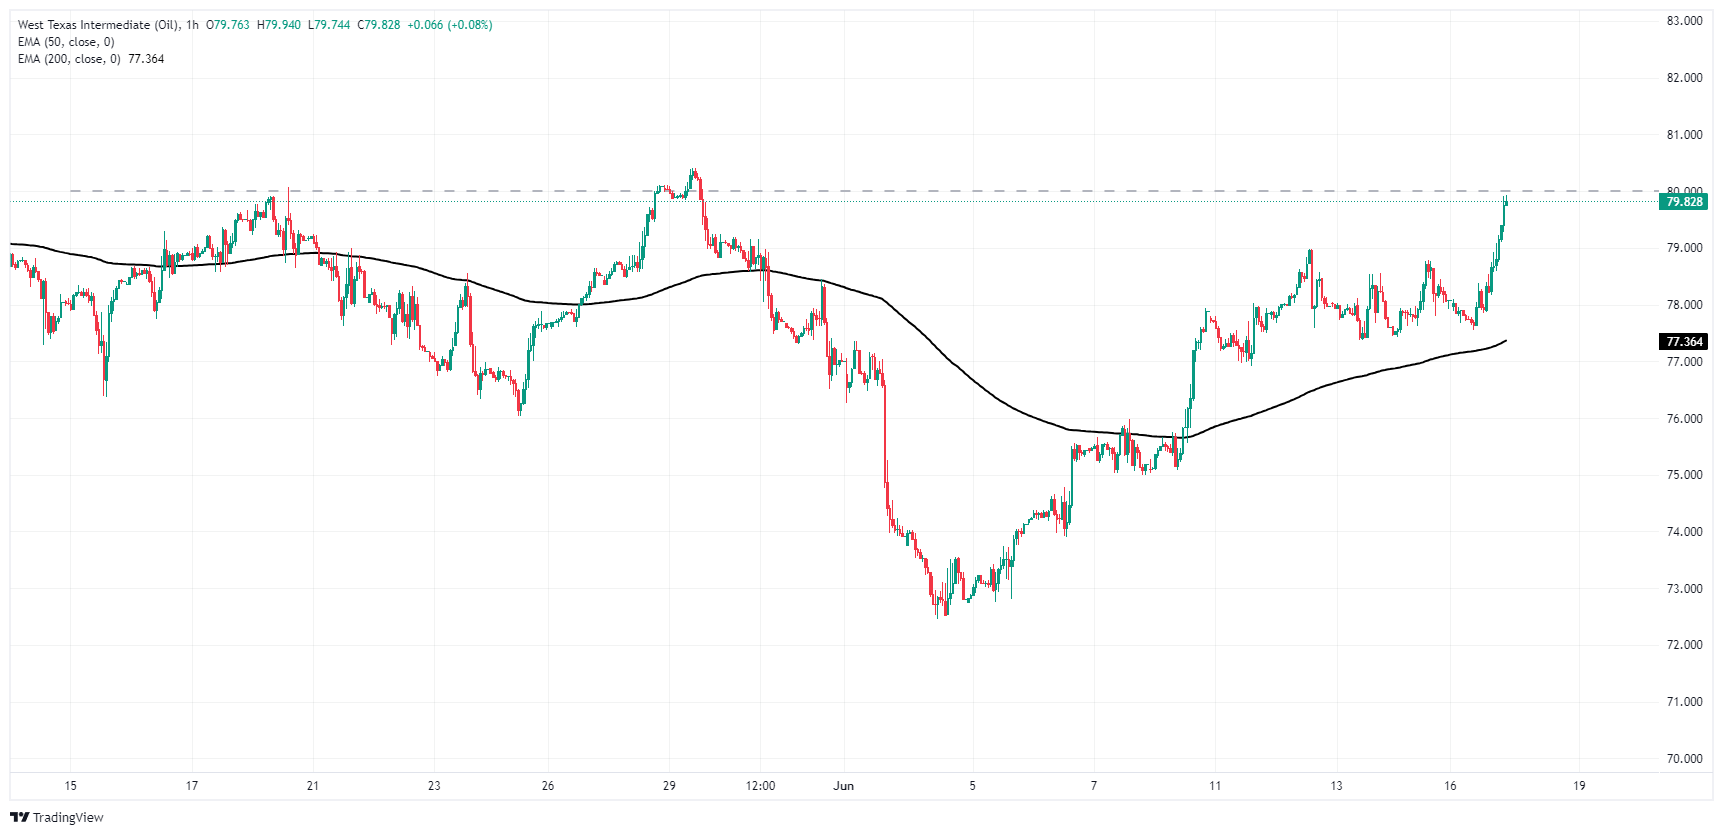
WTI daily chart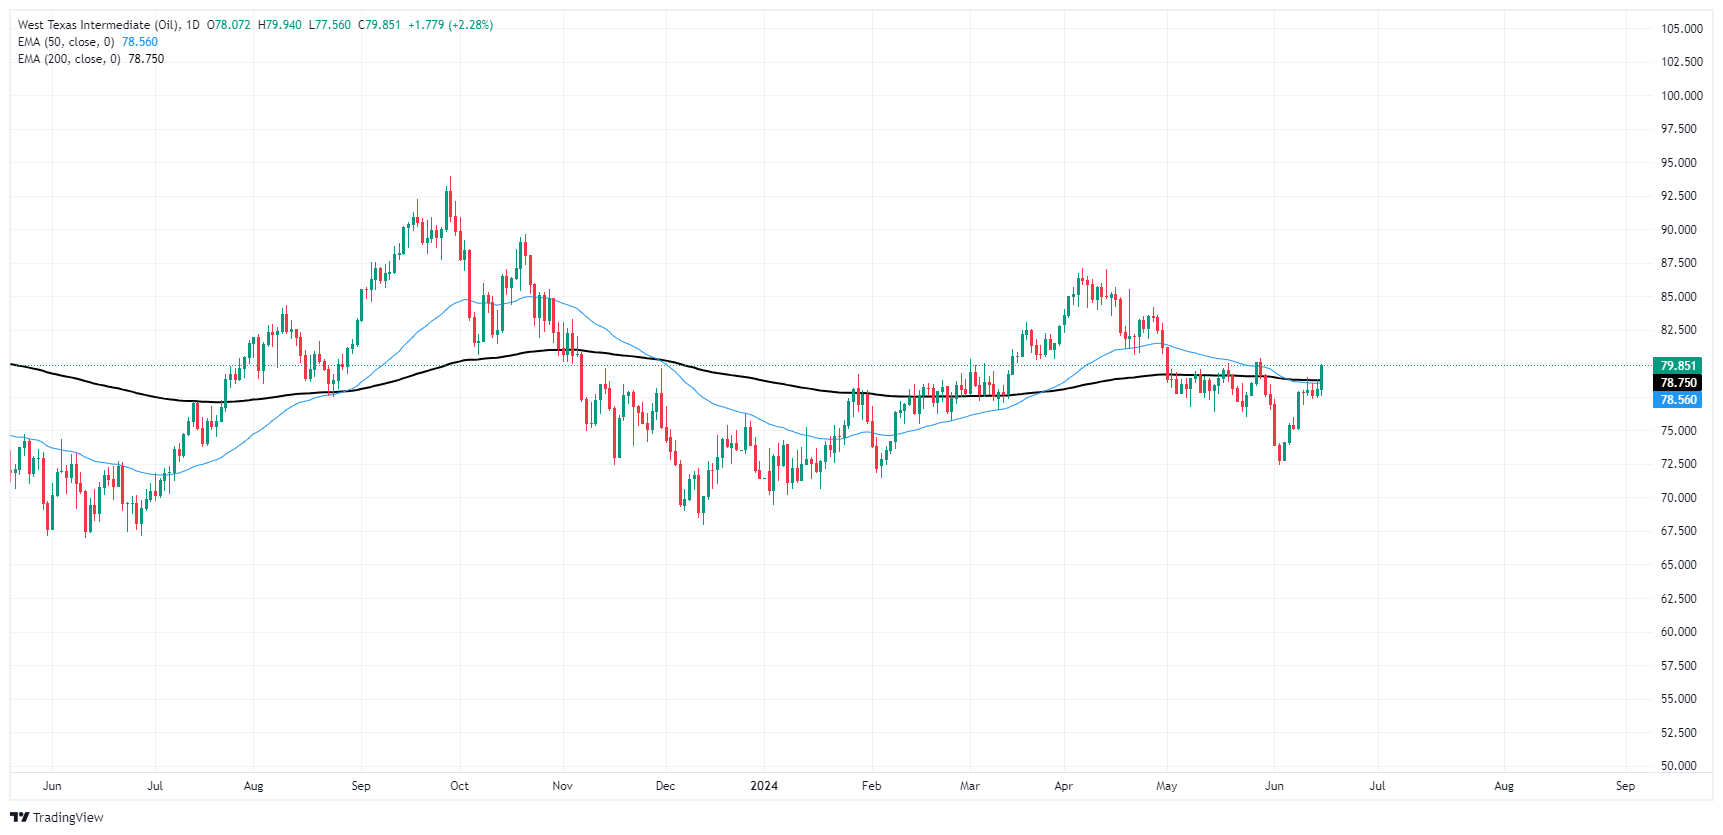
Recommended Articles


