Silver Price Analysis: Establishes another lower low as downtrend extends

Source Fxstreet
  • Silver posts another lower low as it continues its steady decline. 
  • The 50-day SMA, however, could provide an obstacle to further weakness. 
  • The RSI momentum indicator is converging bullishly with price.  

Silver (XAG/USD) trades almost 2.0% lower on Thursday after the release of US factory-gate inflation data.

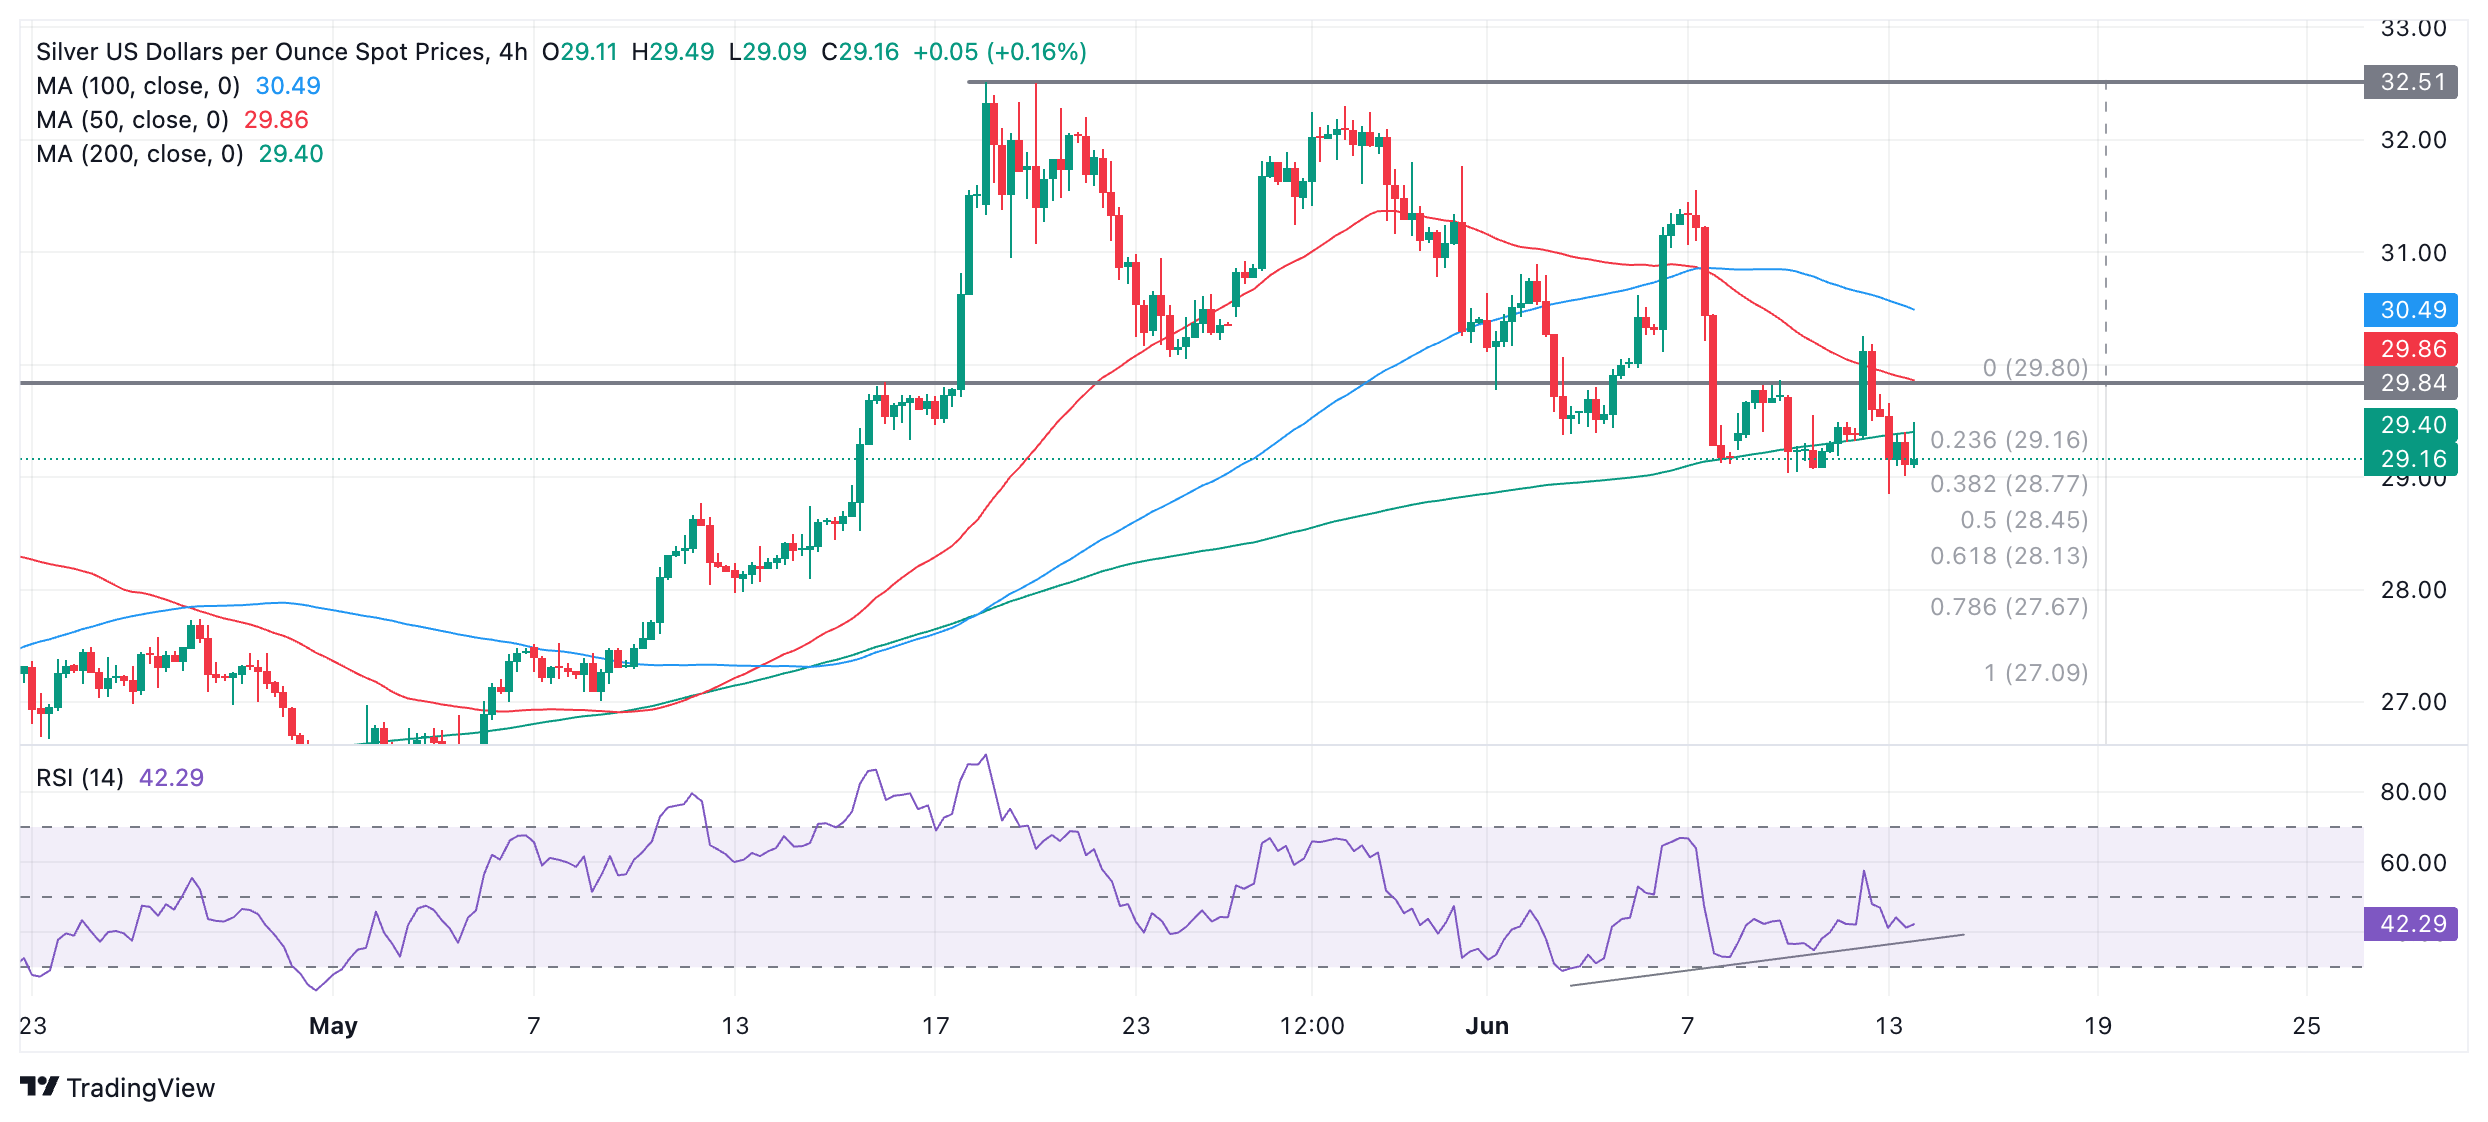
The precious metal has broken below $29.04 (June 11 low) and thereby posted a lower low at $28.85, the low of the day. 

The sequence of lower lows and lower highs witnessed since the May highs suggests Silver is in a short-term downtrend, which given “the trend is your friend” is expected to extend. 

Silver 4-hour Chart 

A break below $28.85 (June 13 low) would confirm another lower low, continuing the bearish sequence. 

There is a chance Silver could fall to an initial target at $28.21, the 0.618 Fibonacci ratio of the height of the range that unfolded in the second half of May, extrapolated lower. This is the usual method used by technical analysts for establishing targets after breakouts from ranges.

The 50-day Simple Moving Average (SMA) at $28.93, however, could provide a barrier to further downside. 

That said, more bearishness could still see Silver reach as low as $27.19, the second target at the 100% extrapolation of the height of the range lower. 

The Relative Strength Index (RSI) is showing bullish convergence with price since the June 4 low. Although price has gone on to make progressively lower lows, RSI has not. The non-correlation indicates a lack of bearish momentum and increases the risk of Silver making a pullback or a recovery. 

It would take a close above $31.00 to bring the short-term downtrend into doubt. A move above the $31.55 lower high would suggest the possibility of a recovery to the range high at $32.51, and a reversal of the short-term trend too. 


Disclaimer: For information purposes only. Past performance is not indicative of future results.
placeholder
Ethereum Price Forecast: ETH tests $3,000 following strong ETF and treasury inflowsEthereum (ETH) climbed above $2,900 on Thursday, mimicking the rally seen in Bitcoin.
Author  FXStreet
Yesterday 01: 36
Ethereum (ETH) climbed above $2,900 on Thursday, mimicking the rally seen in Bitcoin.
placeholder
Bitcoin's surge to new all-time high sparks $1 billion in short liquidationsBitcoin (BTC) traded above 4% on Thursday after soaring to a new all-time high above $116,800. The rally, which appears to be leverage-driven, triggered over a $1 billion short-squeeze across the entire crypto market.
Author  FXStreet
Yesterday 03: 24
Bitcoin (BTC) traded above 4% on Thursday after soaring to a new all-time high above $116,800. The rally, which appears to be leverage-driven, triggered over a $1 billion short-squeeze across the entire crypto market.
placeholder
Japanese Yen dives back closer to weekly trough against a broadly firmer USDThe Japanese Yen (JPY) drifts lower against a broadly stronger US Dollar (USD) during the Asian session on Friday.
Author  FXStreet
Yesterday 03: 45
The Japanese Yen (JPY) drifts lower against a broadly stronger US Dollar (USD) during the Asian session on Friday.
placeholder
Dogecoin (DOGE) Rockets to $0.20 — Can It Go Even Higher?Dogecoin started a fresh increase above the $0.180 zone against the US Dollar.
Author  NewsBTC
21 hours ago
Dogecoin started a fresh increase above the $0.180 zone against the US Dollar.
placeholder
Gold price approaches weekly high as tariff jitters boost safe-haven demandGold price (XAU/USD) is gaining positive traction for the third consecutive day on Friday and approaching the top end of its weekly range amid rising trade tensions.
Author  FXStreet
21 hours ago
Gold price (XAU/USD) is gaining positive traction for the third consecutive day on Friday and approaching the top end of its weekly range amid rising trade tensions.
Related Instrument
goTop
quote