Silver Price Analysis: Spikes higher and threatens to break back above key resistance

Source Fxstreet
  • Silver shoots up after the release of US inflation data. 
  • It threatens to break above an important resistance level at $30.00. 
  • At the same time the precious metal continues to make lower lows suggesting a bearish bias in the short-term. 

Silver (XAG/USD) pops higher after market-moving data on Wednesday and attempts to break back above a key resistance level at $30.00, the top of a four-year consolidation range. 

The precious metal temporarily rises above the red 50 Simple Moving Average (SMA) reaching a high of $30.26 after the release of US Consumer Price Index (CPI) data, however, it has fallen back down and is currently trading in the $29.90s. It is unclear whether it will break back above the resistance level on a closing 4-hour period basis or not. 

Silver 4-hour Chart 

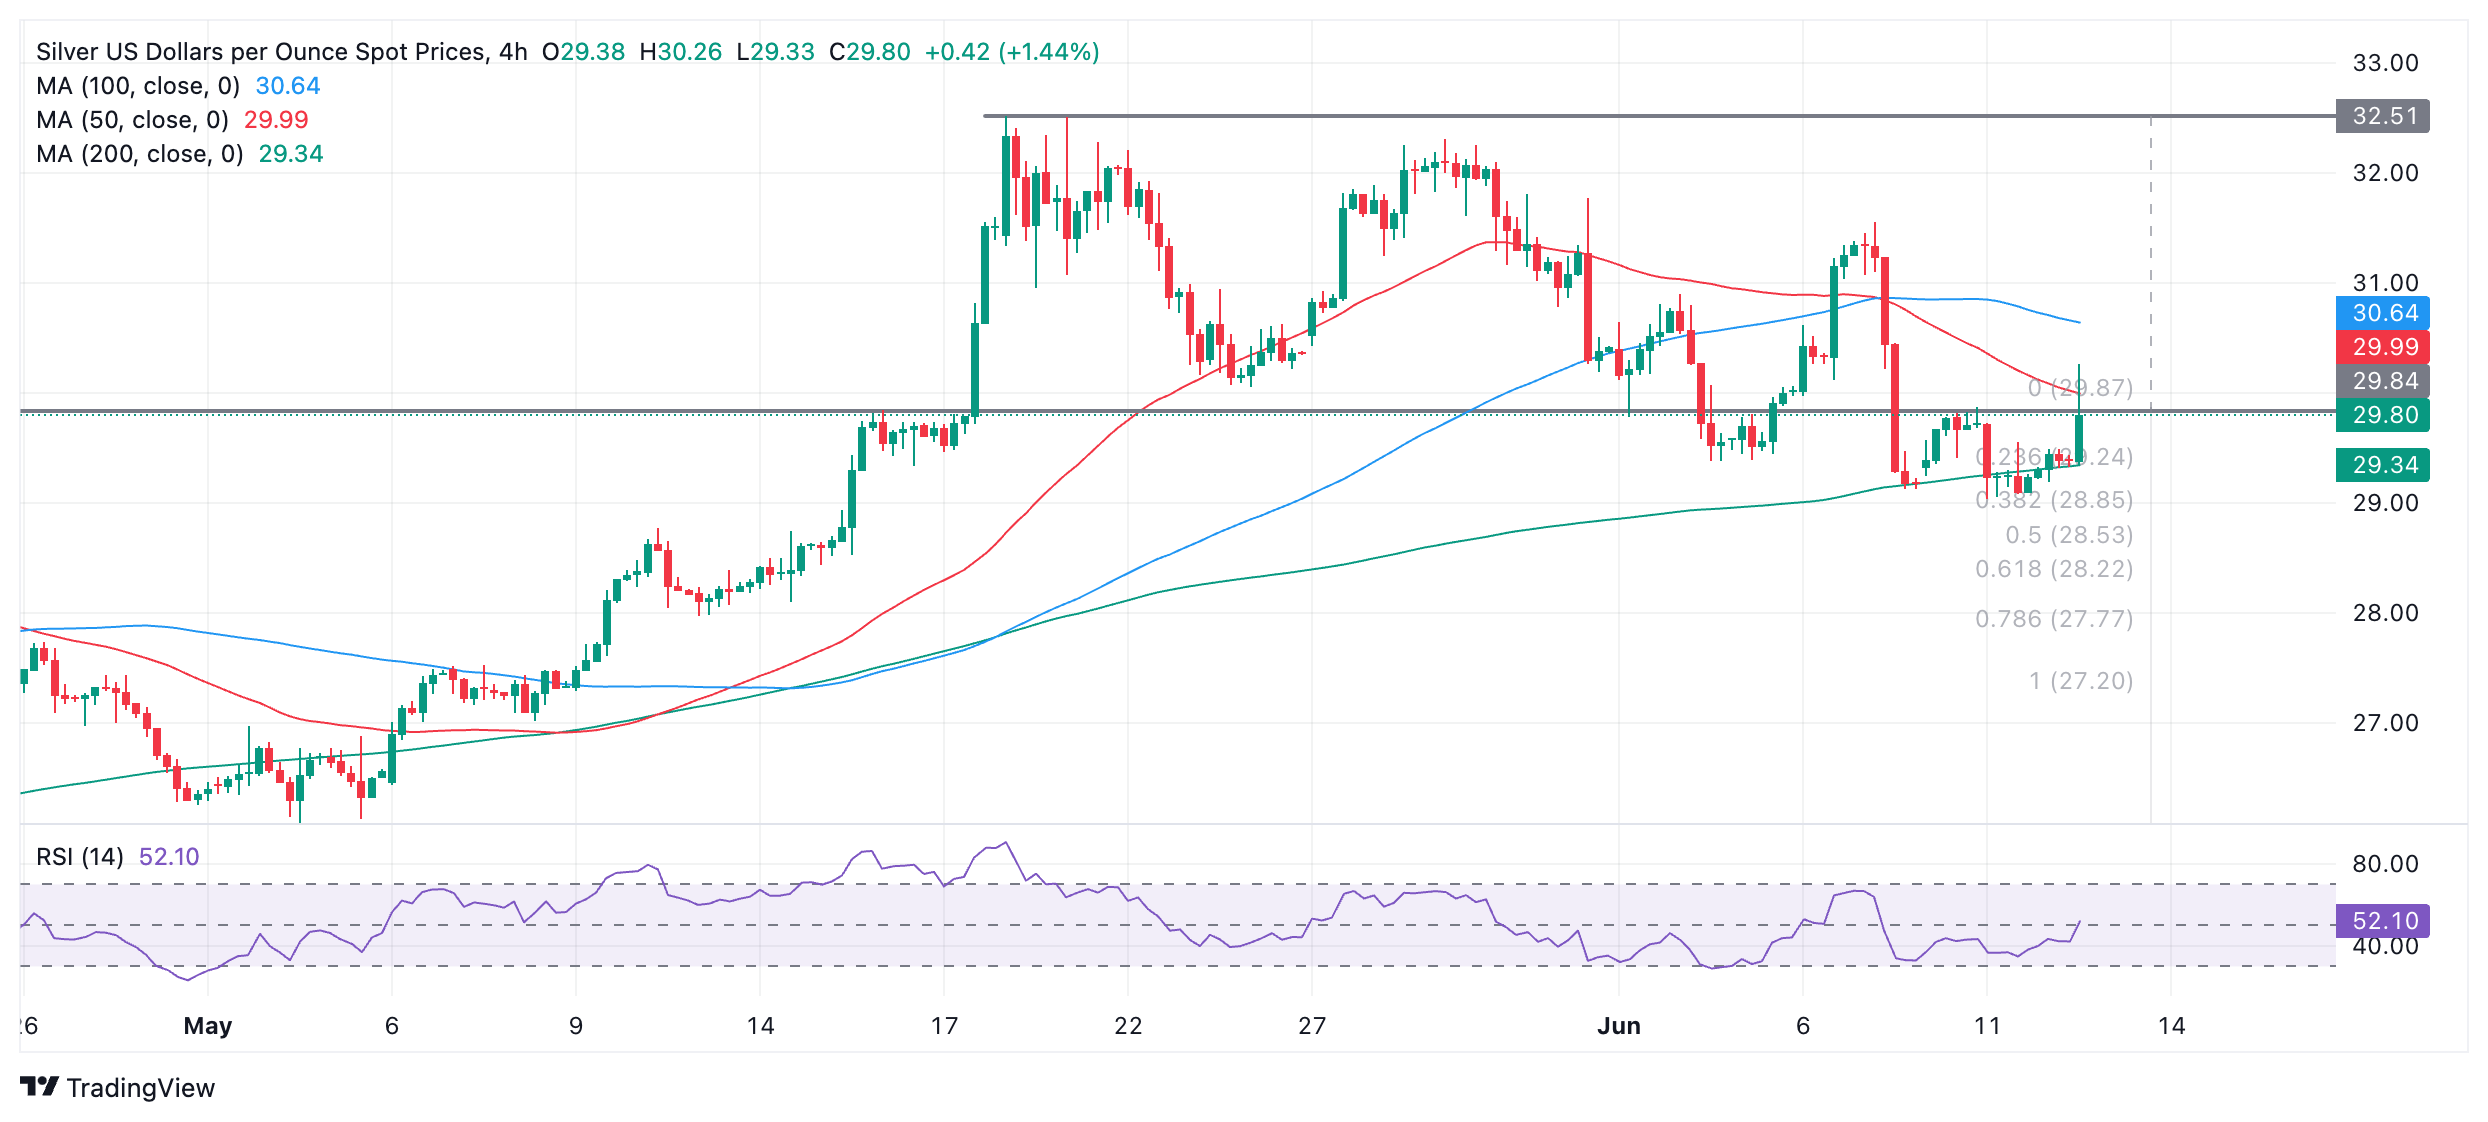
Prior to the spike, Silver had fallen to a new lower low of $29.04, just below the 200 Simple Moving Average (SMA).  

A break back below $29.04 (June 11 low) would confirm another lower low, continuing the sequence of Silver’s step declines since it rolled over from its peak at $32.51 established in May. 

There is a possibility it could fall to an initial target at $28.21, the 0.618 Fibonacci ratio of the height of the range that unfolded in the second half of May, extrapolated lower. This is the usual method used by technical analysts for establishing targets after breakouts from ranges. Further bearishness could see Silver even reach as low as $27.19, the 100% extrapolation of the height of the range lower. 

Alternatively a close back above the $30.00 resistance level would bring the short-term bear bias into doubt. A move above the $31.55 lower high would suggest the possibility of a recovery back up to the range high at $32.51 and a change in the short-term trend. 


Disclaimer: For information purposes only. Past performance is not indicative of future results.
placeholder
Bitcoin Price Forecast: BTC battles at key technical zone amid mixed flow signalsBitcoin (BTC) steadies around the key technical support on Tuesday after its recent correction. The Crypto King’s next directional move could hinge on this key technical zone.
Author  FXStreet
11 hours ago
Bitcoin (BTC) steadies around the key technical support on Tuesday after its recent correction. The Crypto King’s next directional move could hinge on this key technical zone.
placeholder
WTI declines below $102.00 after Trump says he called off Iran attacksWest Texas Intermediate (WTI), the US crude oil benchmark, is trading around $101.85 during the early Asian trading hours on Tuesday. The WTI price declines after US President Donald Trump said he was holding off a military attack on Iran planned for Tuesday at the request of Gulf states.
Author  FXStreet
20 hours ago
West Texas Intermediate (WTI), the US crude oil benchmark, is trading around $101.85 during the early Asian trading hours on Tuesday. The WTI price declines after US President Donald Trump said he was holding off a military attack on Iran planned for Tuesday at the request of Gulf states.
placeholder
Iran Situation Rekindles Threat of War. Bitcoin Price Decline Accelerates, $75,000 Geopolitical Defense Line Faces TestU.S.-Israel discussions on resuming strikes against Iran trigger an accelerated Bitcoin price pullback; future gains depend on whether the $75,000 support level holds.On May 18, the poten
Author  TradingKey
Yesterday 09: 03
U.S.-Israel discussions on resuming strikes against Iran trigger an accelerated Bitcoin price pullback; future gains depend on whether the $75,000 support level holds.On May 18, the poten
placeholder
Euro softens to near 1.1600 on US–Iran tensions The EUR/USD pair trades in negative territory around 1.1615 during the early Asian session on Monday. The Euro (EUR) extends the decline as the prolonged US-Iran conflict weighs on the riskier assets.
Author  FXStreet
Yesterday 01: 34
The EUR/USD pair trades in negative territory around 1.1615 during the early Asian session on Monday. The Euro (EUR) extends the decline as the prolonged US-Iran conflict weighs on the riskier assets.
placeholder
Financial Markets 2026: Volatility Catalysts in Gold, Silver, Oil, and Blue-Chip Stocks—A CFD Trader's OutlookGet a comprehensive financial market 2026 outlook exploring key economic drivers, volatility catalysts in gold, oil and stocks, and what the evolving economic outlook means for cfd trading strategies and risk management on global markets.
Author  Rachel Weiss
May 15, Fri
Get a comprehensive financial market 2026 outlook exploring key economic drivers, volatility catalysts in gold, oil and stocks, and what the evolving economic outlook means for cfd trading strategies and risk management on global markets.
Related Instrument
goTop
quote