Silver Price Analysis: XAG/USD tanks towards $31.00 as ‘evening star’ emerges

Source Fxstreet
  • Silver prices tumbled even though US bond yields fell.
  • The formation of an ‘evening star’ can pave the way to challenge lower prices.
  • XAG/USD to consolidate around $31.00 if buyers hold firm around the latter.

Silver prices dropped from daily highs that had reached around $32.09 earlier, even though US Treasury bond yields tumbled. A late recovery of the US Dollar, trimming some of its losses, weighed on the grey metal, which is down more than 2.80%. At the time of writing, the XAG/USD trades at $31.06 and falls to three-day lows.

XAG/USD Price Analysis: Technical outlook

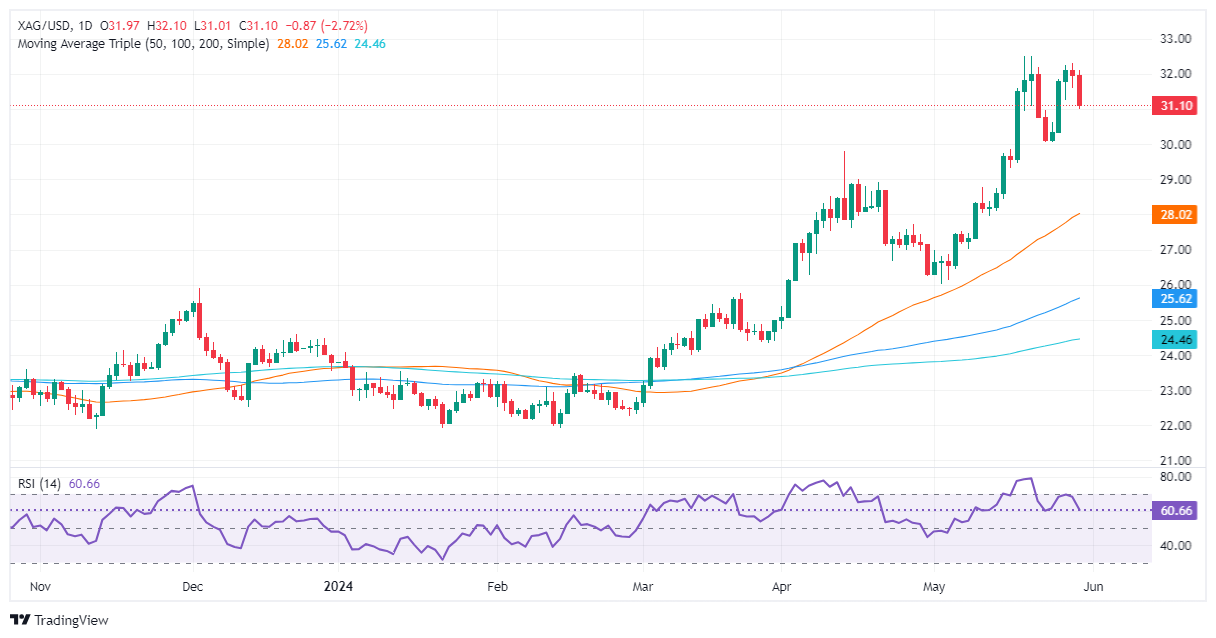
After rallying toward the year-to-date (YTD) high of $32.51, the non-yielding metal dipped to $30.05 before launching another attack toward the YTD highs. However, bullish momentum seems to be fading, as depicted by the Relative Strength Index (RSI), which, despite remaining above the 50-midline, aims lower, showing sellers’ strength. Alongside that, the formation of an ‘evening star’ hints that a further downside is seen.

 If XAG/USD drops below $31.00, further losses lie beneath. The next support would be the May 24 latest cycle low of $30.05, followed by the April 12 high of $29.79. Once cleared, the next stop would be the $29.00 psychological level.

On the flip side, if buyers keep silver spot prices above $31.00, that would pave the way for consolidation, around the $31.00/$32.00 range.

XAG/USD Price Action – Daily Chart

XAG/USD

Overview
Today last price 31.11
Today Daily Change -0.86
Today Daily Change % -2.69
Today daily open 31.97
 
Trends
Daily SMA20 29.51
Daily SMA50 27.91
Daily SMA100 25.54
Daily SMA200 24.42
 
Levels
Previous Daily High 32.3
Previous Daily Low 31.6
Previous Weekly High 32.51
Previous Weekly Low 30.05
Previous Monthly High 29.8
Previous Monthly Low 24.75
Daily Fibonacci 38.2% 31.87
Daily Fibonacci 61.8% 32.04
Daily Pivot Point S1 31.62
Daily Pivot Point S2 31.26
Daily Pivot Point S3 30.92
Daily Pivot Point R1 32.32
Daily Pivot Point R2 32.66
Daily Pivot Point R3 33.02


Disclaimer: For information purposes only. Past performance is not indicative of future results.
placeholder
Natural Gas sinks to pivotal level as China’s demand slumpsNatural Gas price (XNG/USD) edges lower and sinks to $2.56 on Monday, extending its losing streak for the fifth day in a row. The move comes on the back of China cutting its Liquified Natural Gas (LNG) imports after prices rose above $3.0 in June. It
Author  FXStreet
Jul 01, 2024
Natural Gas price (XNG/USD) edges lower and sinks to $2.56 on Monday, extending its losing streak for the fifth day in a row. The move comes on the back of China cutting its Liquified Natural Gas (LNG) imports after prices rose above $3.0 in June. It
placeholder
Pi Network Price Annual Forecast: PI Heads Into a Volatile 2026 as Utility Questions Collide With Big UnlocksPi Network heads into 2026 after a 90%+ 2025 drawdown from $3.00, with 17.5 million KYC users and a smart-contract-focused Stellar v23 upgrade offering upside potential, but 1.21 billion tokens unlocking and heavy exchange deposits (437 million PI) keeping supply pressure and trust risks firmly in focus.
Author  Mitrade
Dec 19, 2025
Pi Network heads into 2026 after a 90%+ 2025 drawdown from $3.00, with 17.5 million KYC users and a smart-contract-focused Stellar v23 upgrade offering upside potential, but 1.21 billion tokens unlocking and heavy exchange deposits (437 million PI) keeping supply pressure and trust risks firmly in focus.
placeholder
ECB Policy Outlook for 2026: What It Could Mean for the Euro’s Next MoveWith the ECB likely holding rates steady at 2.15% and the Fed potentially extending cuts into 2026, EUR/USD may test 1.20 if Eurozone growth proves resilient, but weaker growth and an ECB pivot could pull the pair back toward 1.13 and potentially 1.10.
Author  Mitrade
Dec 26, 2025
With the ECB likely holding rates steady at 2.15% and the Fed potentially extending cuts into 2026, EUR/USD may test 1.20 if Eurozone growth proves resilient, but weaker growth and an ECB pivot could pull the pair back toward 1.13 and potentially 1.10.
placeholder
My Top 5 Stock Market Predictions for 2026Five 2026 market predictions written in a native, news-style voice: AI’s winners and losers, broader sector leadership, dividend demand, valuation cooling as the Shiller CAPE sits at 39 (Dec. 31, 2025), and quantum-computing bursts—while keeping all original facts and numbers unchanged.
Author  Mitrade
Jan 06, Tue
Five 2026 market predictions written in a native, news-style voice: AI’s winners and losers, broader sector leadership, dividend demand, valuation cooling as the Shiller CAPE sits at 39 (Dec. 31, 2025), and quantum-computing bursts—while keeping all original facts and numbers unchanged.
placeholder
WTI recovers to near $86.50 as Strait of Hormuz remains closedWest Texas Intermediate (WTI), the US crude oil benchmark, is trading around $86.40 during the early Asian trading hours on Tuesday. The WTI price faces extreme volatility following a massive spike to nearly $120 per barrel in the previous session. 
Author  FXStreet
Mar 10, Tue
West Texas Intermediate (WTI), the US crude oil benchmark, is trading around $86.40 during the early Asian trading hours on Tuesday. The WTI price faces extreme volatility following a massive spike to nearly $120 per barrel in the previous session. 
Related Instrument
goTop
quote