

Silver Price Analysis: XAG/USD trades with modest gains near $23.00, bearish bias remains

Source Fxstreet
  • Silver attracts buyers on Thursday and snaps a three-day losing streak to the weekly low.
  • The technical setup supports prospects for the emergence of fresh selling at higher levels.
  • Bears might wait for a break below $22.70 or the monthly low before placing fresh bets.

Silver (XAG/USD) gains some positive traction on Thursday and for now, seems to have snapped a three-day losing streak to the weekly low, around the $22.80-$22.75 region touched the previous day. The white metal sticks to its intraday gains through the first half of the European session and currently trades around the $23.00 round figure, up 0.60% for the day.

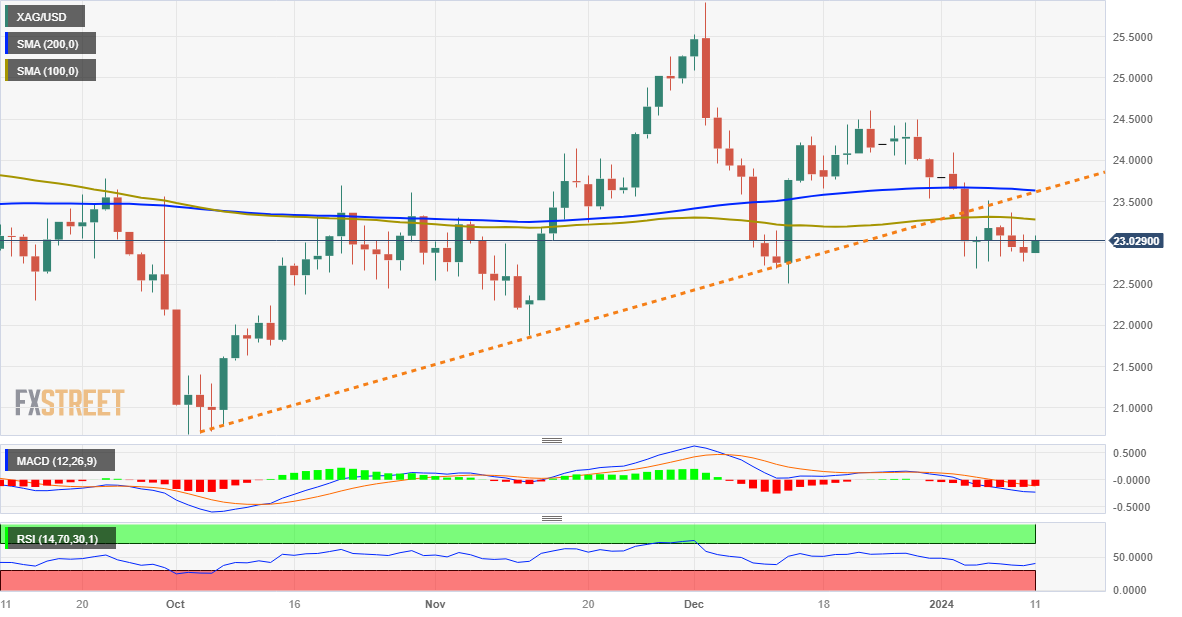
From a technical perspective, any subsequent move up is likely to confront resistance near the 100-day Simple Moving Average (SMA), currently pegged near the $23.30 region. This is followed by a multi-month-old ascending trend-line support breakpoint, around the $23.60 region, which now coincides with the 200-day SMA and should act as a key pivotal point. A sustained strength beyond the latter might trigger a short-covering rally and lift the XAG/USD to the $23.80 horizontal resistance en route to the $24.00 round-figure mark.

Some follow-through buying will suggest that the recent corrective downfall since late December has run its course and shift the bias in favour of bullish traders. The XAG/USD might then accelerate the positive momentum towards the $24.60 area, or the December 22 high, before aiming back towards reclaiming the $25.00 psychological mark. That said, oscillators on the daily chart are holding deep in the negative territory and support prospects for the emergence of fresh selling at higher levels. This, in turn, favours bearish traders and suggests that the path of least resistance for the white metal remains to the downside.

That said, it will still be prudent to wait for weakness below a multi-week low, around the $22.70 region touched last Thursday before positioning for the resumption of the recent depreciating move witnessed over the past two weeks or so. The XAG/USD might then turn vulnerable to weaken further below the December monthly swing low, around the mid-$22.00s and test the next relevant support near the $22.25 region before eventually dropping further towards the $22.00 round-figure mark.

Silver daily chart
fxsoriginal

Technical levels to watch


Disclaimer: For information purposes only. Past performance is not indicative of future results.
placeholder
Financial Markets 2026: Volatility Catalysts in Gold, Silver, Oil, and Blue-Chip Stocks—A CFD Trader's OutlookGet a comprehensive financial market 2026 outlook exploring key economic drivers, volatility catalysts in gold, oil and stocks, and what the evolving economic outlook means for cfd trading strategies and risk management on global markets.
Author  Rachel Weiss
May 15, Fri
Get a comprehensive financial market 2026 outlook exploring key economic drivers, volatility catalysts in gold, oil and stocks, and what the evolving economic outlook means for cfd trading strategies and risk management on global markets.
placeholder
Finding The Best Japan Stocks to Buy? These are Top Japanese Companies to Watch Discover the best Japanese stocks to buy, including AI semiconductor leaders, Buffett-backed trading houses, and undervalued Japan stocks benefiting from corporate reforms and yen trends.
Author  Mitrade
May 29, Fri
Discover the best Japanese stocks to buy, including AI semiconductor leaders, Buffett-backed trading houses, and undervalued Japan stocks benefiting from corporate reforms and yen trends.
placeholder
Gold Price Forecast: Cooling Rate Hike Expectations Push Gold Above $4,400, Eyeing $4,500 Next As of the European session on August 11, gold prices (XAUUSD) briefly topped $4,400 intraday, reaching a high of $4,435.2, its highest level since June 5. However, gains subsequently narr
Author  TradingKey
Aug 11, Tue
As of the European session on August 11, gold prices (XAUUSD) briefly topped $4,400 intraday, reaching a high of $4,435.2, its highest level since June 5. However, gains subsequently narr
placeholder
WTI declines below $82.50 as oil inventories rise far more than expectedWest Texas Intermediate (WTI), the US crude oil benchmark, is trading around $82.45 during the early Asian trading hours on Thursday. WTI declines on a larger-than-expected build in US crude oil inventories. Traders will closely monitor the developments surrounding US-Iran talks for fresh impetus. 
Author  FXStreet
23 hours ago
West Texas Intermediate (WTI), the US crude oil benchmark, is trading around $82.45 during the early Asian trading hours on Thursday. WTI declines on a larger-than-expected build in US crude oil inventories. Traders will closely monitor the developments surrounding US-Iran talks for fresh impetus. 
placeholder
Forex Today: US Dollar stabilizes ahead of next batch of US dataHere is what you need to know on Thursday, August 13:
Author  FXStreet
14 hours ago
Here is what you need to know on Thursday, August 13:
Related Instrument
goTop
quote