Silver Price Analysis: XAG/USD surges above $31.50 amid thin trading

Source Fxstreet
  • Silver rallies over 4%, trading at $31.42 after rebounding from a low of $30.25 in thin liquidity.
  • Technicals indicate strong upward bias, with bullish RSI not yet overbought.
  • Key resistance levels: Psychological $32.00 figure, YTD high at $32.51, and $33.00 mark.
  • Key support levels: $31.00 figure, $30.50 psychological level, and May 23 low of $30.07.

Silver prices rallied sharply on Monday, posting gains of more than 4%. At the time of writing, they were at $31.42. The grey metal bounced off daily lows of $30.25, capitalizing on thin liquidity conditions as Wall Street remained closed in observance of Memorial Day.

XAG/USD Price Analysis: Technical outlook

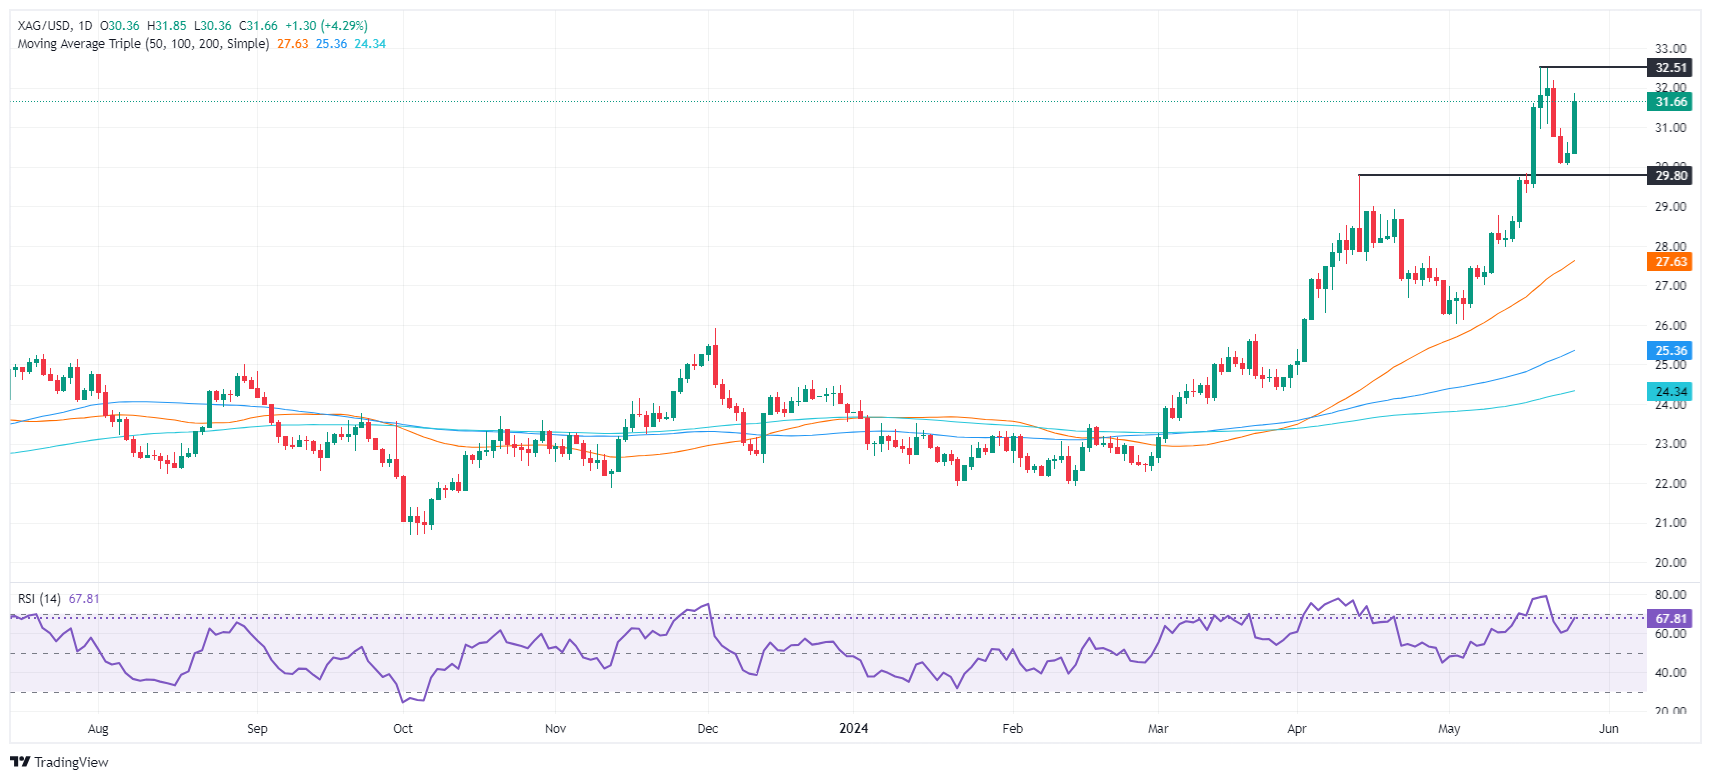
The daily chart suggests that Silver is upward-biased, yet it remains shy of testing the year-to-date (YTD) high of 32.51. Momentum supports buyers, as the Relative Strength Index (RSI) remains bullish though short of turning overbought.

With that said, the XAG/USD first resistance would be the psychological $32.00 figure. Once cleared, overhead resistance lies with the YTD high, followed by the $33.00 mark.

Conversely, the XAG/USD first support would be the $31.00 figure. Further losses lie below that demand area, like the $30.50 psychological level, followed by the May 23 low of $30.07.

XAG/USD Price Action – Daily Chart

XAG/USD

Overview
Today last price 31.63
Today Daily Change 1.27
Today Daily Change % 4.18
Today daily open 30.36
 
Trends
Daily SMA20 28.72
Daily SMA50 27.5
Daily SMA100 25.27
Daily SMA200 24.29
 
Levels
Previous Daily High 30.62
Previous Daily Low 30.05
Previous Weekly High 32.51
Previous Weekly Low 30.05
Previous Monthly High 29.8
Previous Monthly Low 24.75
Daily Fibonacci 38.2% 30.4
Daily Fibonacci 61.8% 30.27
Daily Pivot Point S1 30.06
Daily Pivot Point S2 29.76
Daily Pivot Point S3 29.48
Daily Pivot Point R1 30.64
Daily Pivot Point R2 30.92
Daily Pivot Point R3 31.22


Disclaimer: For information purposes only. Past performance is not indicative of future results.
placeholder
Crypto Weekly Radar: All eyes on Donald Trump’s ultimatum, US macroeconomic dataCrypto markets begin the week with mixed sentiment, with Bitcoin (BTC) trading above $69,000 following last week’s rebound. Still, markets remain cautious as traders weigh risks stemming from Donald Trump’s renewed threats toward Iran ahead of the ultimatum set for Tuesday.
Author  FXStreet
13 hours ago
Crypto markets begin the week with mixed sentiment, with Bitcoin (BTC) trading above $69,000 following last week’s rebound. Still, markets remain cautious as traders weigh risks stemming from Donald Trump’s renewed threats toward Iran ahead of the ultimatum set for Tuesday.
placeholder
WTI eases below $103.50 as US, Iran reportedly seeking 45-day ceasefireWest Texas Intermediate (WTI), the US crude oil benchmark, is trading around $103.30 during the early European trading hours on Monday. The WTI price retreats after reports that the United States (US) and Iran are making a push for a 45-day ceasefire. 
Author  FXStreet
13 hours ago
West Texas Intermediate (WTI), the US crude oil benchmark, is trading around $103.30 during the early European trading hours on Monday. The WTI price retreats after reports that the United States (US) and Iran are making a push for a 45-day ceasefire. 
placeholder
Gold under pressure as fears mount, $4,600 support at risk Spot Gold gapped marginally lower at the weekly opening, with the XAU/USD pair battling to retain the $4,600 mark early in the Asian session.
Author  TradingKey
21 hours ago
Spot Gold gapped marginally lower at the weekly opening, with the XAU/USD pair battling to retain the $4,600 mark early in the Asian session.
placeholder
Gold Second-Quarter Outlook: Safe-Haven Failure or Pricing Logic Reshaping? Can Gold Enter a Major Rally?In the first quarter of 2026, gold prices experienced a classic "roller-coaster" ride. Against a macroeconomic backdrop of escalating geopolitical conflicts, gold prices briefly broke thr
Author  TradingKey
Apr 03, Fri
In the first quarter of 2026, gold prices experienced a classic "roller-coaster" ride. Against a macroeconomic backdrop of escalating geopolitical conflicts, gold prices briefly broke thr
placeholder
Spot Crude Oil Breaks $140. First Time Since 2008. Oil Market’s Most Severe Shock in History Is Here. On Thursday, April 2, Dated Brent crude prices reached $141.37 per barrel, the highest level since 2008, surpassing the peak set during the outbreak of the Russia-Ukraine conflict in 2022
Author  TradingKey
Apr 03, Fri
On Thursday, April 2, Dated Brent crude prices reached $141.37 per barrel, the highest level since 2008, surpassing the peak set during the outbreak of the Russia-Ukraine conflict in 2022
Related Instrument
goTop
quote