

Crude Oil stretches gains, WTI tests $78.50 ahead of inflation data and looming OPEC+ meeting
- WTI climbed further on Monday as US inflation data looms.
- OPEC is broadly expected to maintain voluntary production cuts.
- Rate cut expectations remain key to barrel prices.
West Texas Intermediate (WTI) US Crude Oil continued to gain on Monday, climbing above $78.50 per barrel. Crude Oil is climbing with US markets dark for the Memorial Day holiday, and risk appetite is leaning into the high side as investors look for signs of Federal Reserve (Fed) rate cuts to help bolster Crude Oil.
US Personal Consumption Expenditure (PCE) inflation numbers will be updated later this week, providing a key reading for investors hoping for a rate trim from the Fed. Markets expect Friday’s US PCE Price Index to hold at 2.8% YoY in April.
The Organization of the Petroleum Exporting Countries (OPEC) and its extended membership network, OPEC , are broadly expected to maintain voluntary production caps that were initially adopted in 2023 to prop up global Crude Oil prices. With US production continuing to ramp up and outpace demand, OPEC is likely to keep production limits in place to try and sop up excess production. OPEC ’s meeting is slated for June 2.
Barrel traders will also be keeping an eye out for US week-on-week barrel inventory counts from both the American Petroleum Institute (API) and the Energy Information Administration (EIA), due respectively on Wednesday and Thursday this week. Last week’s US Crude Oil supply tracking saw yet another unexpected buildup of US barrel counts. Market forecasts are doubling down on expecting a decline, with EIA weekly barrel counts forecast to decline by two million barrels on Thursday.
WTI technical outlook
US Crude Oil rebounded on Monday, extending a near-term rebound from the $76.00 handle, however, bullish momentum faces immediate technical resistance at the $80.00 price level. A recovery in WTI sends prices back into recent congestion on the lower bound of the 200-day Exponential Moving Average (EMA) at $79.16.
WTI hourly chart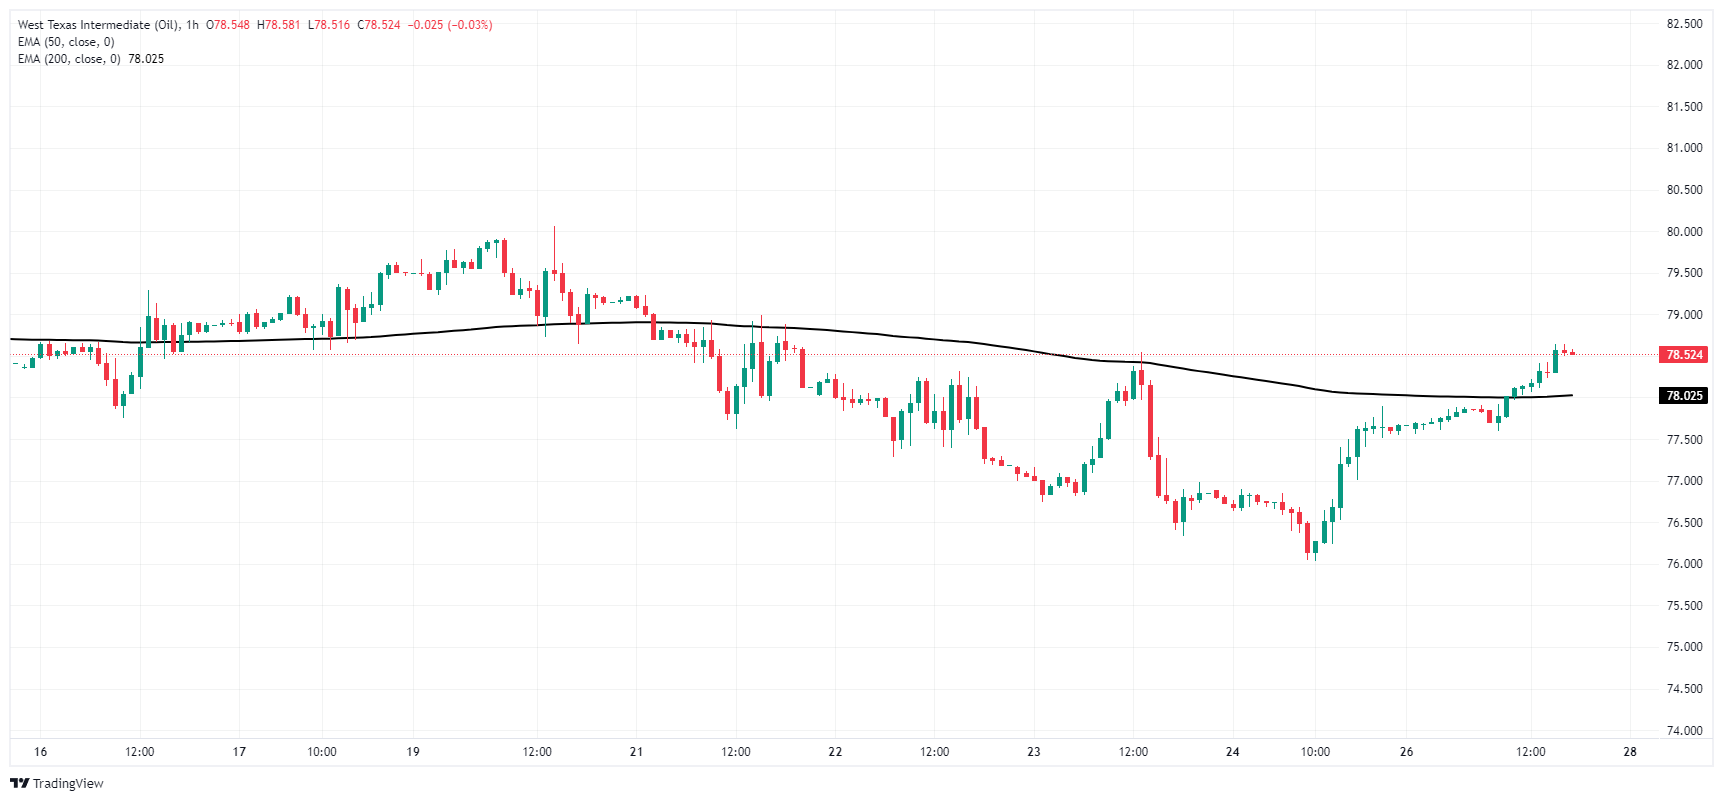
WTI daily chart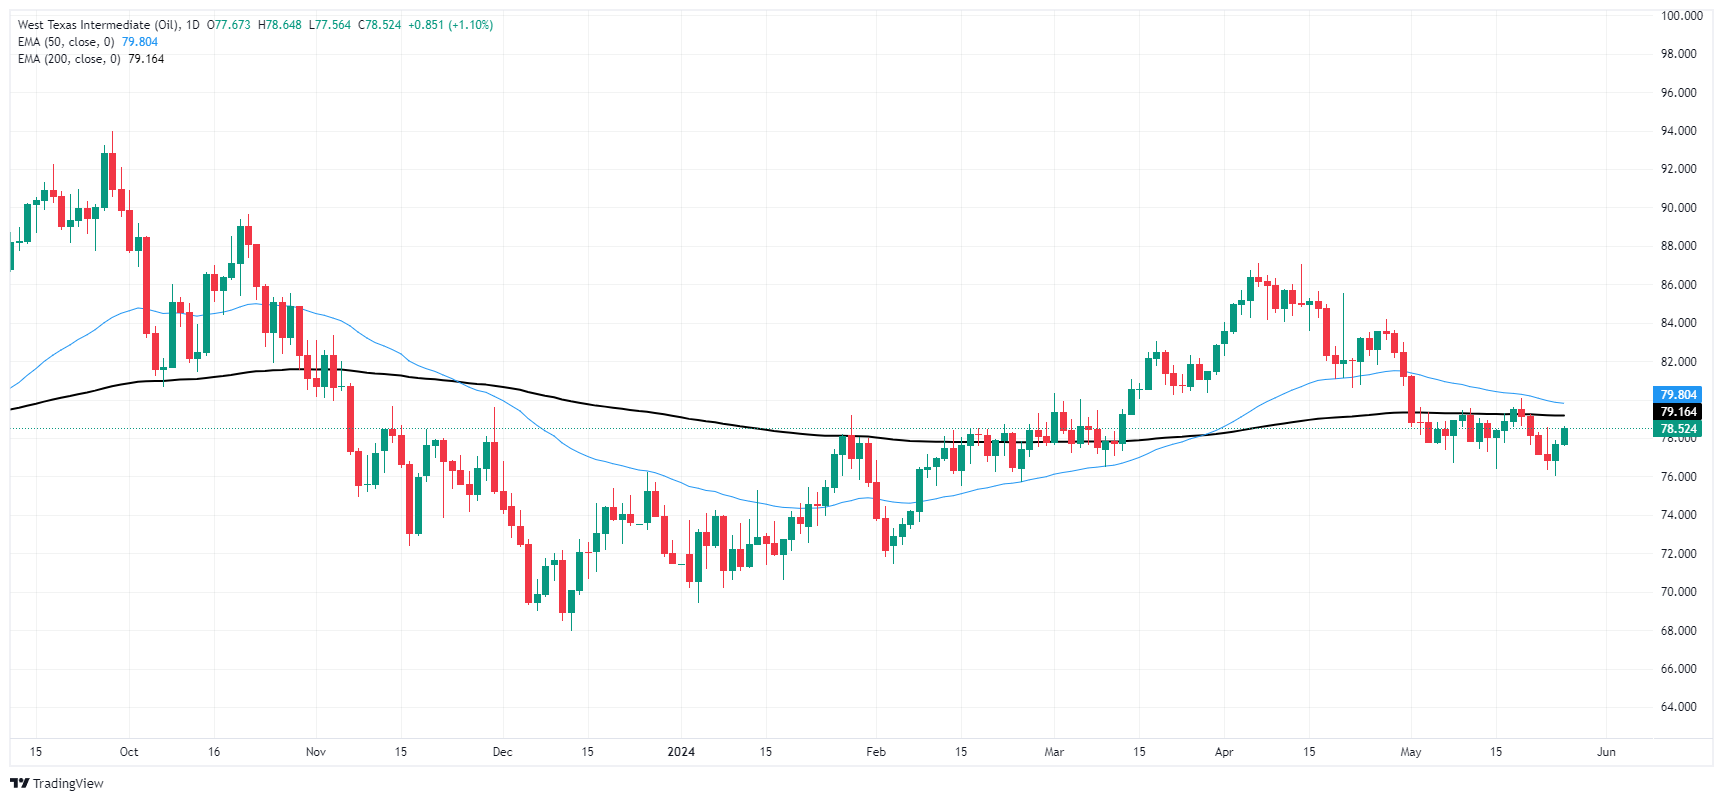
Recommended Articles


