

Natural Gas looks for support after retreating from six-month highs
- Natural Gas prices have declined over 5% from last week’s peak at $3.16 as traders book profits.
- EU court ruling on Gazprom payments might see disrupted Gas flows in Austria.
- The US Dollar Index trades flat after a volatile week.
Natural Gas price (XNG/USD) holds its ground on Monday after reaching a six-month high of $3.16 on Thursday and immediately facing profit taking. The last squeeze came on the back of a Bloomberg article reporting that Austria warned that the remaining Gas flows out of Russia might get disrupted after a court ruling said that European companies no longer need to make payments to Gazprom on deliveries. Traders were pushing up Gas prices ahead of any disruption risk, but now profit-taking is underway and Gas prices are looking for support levels.
The US Dollar Index (DXY), which tracks the Greenback’s value against six major currencies, roughly trades flat after a volatile ride last week. A mixture of geopolitical events with mixed data has pushed the DXY back below 105.00. US markets are closed on Monday due to a bank holiday, and later this week the revised US Gross Domestic Product estimates on Thursday and the US Personal Consumption Expenditure (PCE) Price Index figures on Friday will be the main events.
Natural Gas is trading at $2.78 per MMBtu at the time of writing.
Natural Gas news and market movers: EU refueling disruptions
- Supply concerns linger in the EU after Austria’s OMV AG warned of possible disruptions in Gas flows out of Russia.
- Meanwhile, Bloomberg reported that Italian Gas storages are filled up to 73%, well above its average of 59% for this time of year.
- Brunei LNG is facing a substantial outage and ships awaiting in the harbor. Since May 20, no LNG has left the port.
Natural Gas Technical Analysis: profit taking towards support
Natural Gas is facing pressure after its steep rally last week, which was built up on geopolitical drivers together with rumors on supply disruptions towards Europe. With that last one out of the way, more downside in Gas prices could be at hand, with a bigger part of the recent rally unwinding. Add the peace talk willingness from Russia ahead of the peace talks in mid-June with China, Ukraine and the US around the table, and more easing in Gas prices might take place in the coming weeks.
The $3.00 marker as a big figure was easily broken on Wednesday. The pivotal level near $3.07 (high of March 6, 2023) remains key as prices failed to post a daily close above it. Further up, the fresh year-to-date high at $3.16 is the level to beat.
On the downside, the 200-day Simple Moving Average (SMA) is acting as first support near $2.53. Should that support area fail to hold, then the pivotal level near $2.14 should do the trick ahead of $2.11, where both the 55-day and 100-day SMA are trading.
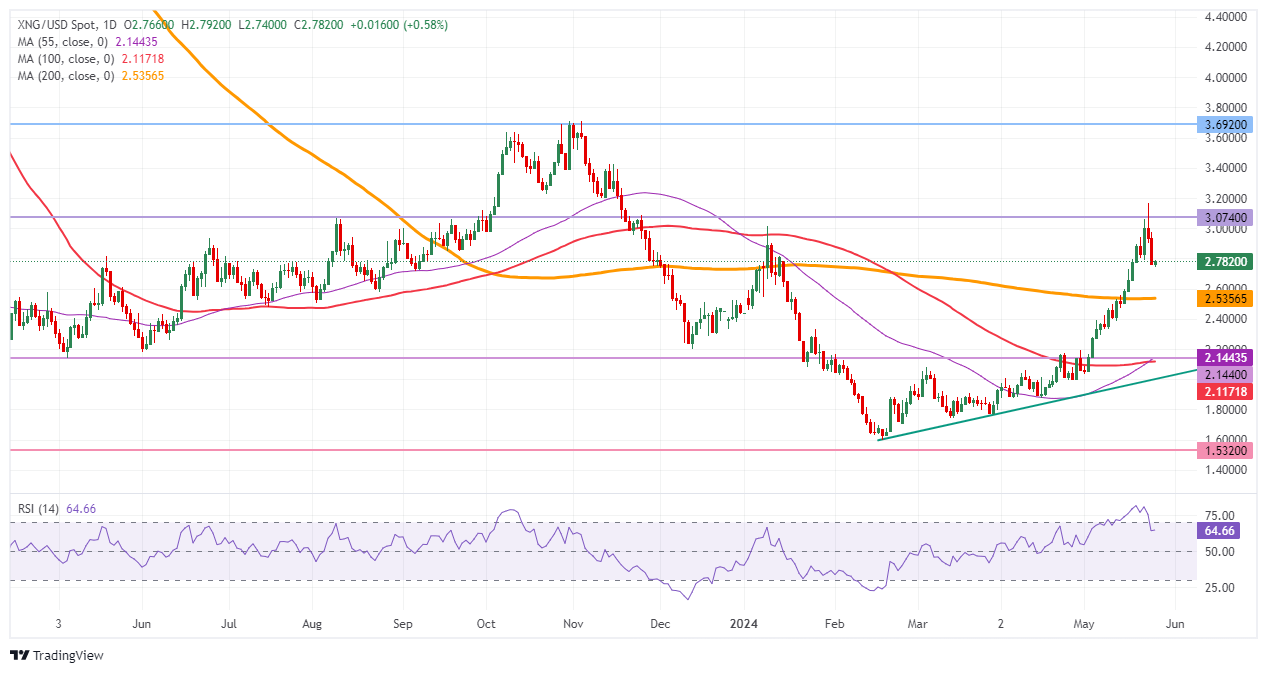
Natural Gas: Daily Chart
Natural Gas FAQs
Supply and demand dynamics are a key factor influencing Natural Gas prices, and are themselves influenced by global economic growth, industrial activity, population growth, production levels, and inventories. The weather impacts Natural Gas prices because more Gas is used during cold winters and hot summers for heating and cooling. Competition from other energy sources impacts prices as consumers may switch to cheaper sources. Geopolitical events are factors as exemplified by the war in Ukraine. Government policies relating to extraction, transportation, and environmental issues also impact prices.
The main economic release influencing Natural Gas prices is the weekly inventory bulletin from the Energy Information Administration (EIA), a US government agency that produces US gas market data. The EIA Gas bulletin usually comes out on Thursday at 14:30 GMT, a day after the EIA publishes its weekly Oil bulletin. Economic data from large consumers of Natural Gas can impact supply and demand, the largest of which include China, Germany and Japan. Natural Gas is primarily priced and traded in US Dollars, thus economic releases impacting the US Dollar are also factors.
The US Dollar is the world’s reserve currency and most commodities, including Natural Gas are priced and traded on international markets in US Dollars. As such, the value of the US Dollar is a factor in the price of Natural Gas, because if the Dollar strengthens it means less Dollars are required to buy the same volume of Gas (the price falls), and vice versa if USD strengthens.
Recommended Articles


