

Gold weakens to major trendline after FOMC Minutes
- Gold has fallen to a key trendline after the release of the FOMC meeting minutes.
- The minutes showed little enthusiasm from Fed officials to lower interest rates – a negative outcome for Gold.
- Gold’s short-term trend is now bearish but it has reached a major trendline and is finding support.
Gold (XAU/USD) has fallen over a half a percent to $2,360s on Thursday, reaching a major trendline on the chart (see chart in section below) where it is currently finding support.
The precious metal weakened after the release of the Federal Reserve (Fed) meeting Minutes, which revealed policymakers were reluctant to lower interest rates – and even discussed hiking them – due to persistent inflationary pressures.
The expectation that interest rates will remain at their current level (or higher) for an extended amount of time was bearish for Gold. As a non-yielding asset, higher interest rates increase the opportunity cost of holding Gold, reducing its attractiveness to investors.
Gold price continues bearish reversal after Fed Minutes
Gold declined sharply after the release of the Federal Open Market Committee (FOMC) meeting Minutes for the April 29-May 1 policy meeting on Wednesday.
The Minutes revealed that although policymakers expected price pressures to ease eventually, they had not fallen quickly enough to warrant a cut in the fed funds rate target range, which would remain at its 5.25% - 5.50% level “at least until September,” according to FXStreet.
The strength of the labor market emerged as a key determining factor for future policy. The Fed’s rate-setters even discussed the possibility of raising interest rates to tackle inflation. This added a more hawkish twist to the proceedings and echoed similar discussions in the Reserve Bank of Australia’s (RBA) meeting Minutes.
The Minutes catalyzed a rally in the US Dollar, which has a negative correlation with Gold.
The next major release for Gold is the US Purchasing Manager Index (PMI) data for May at 13:45 GMT on Thursday. If the data is positive it could have a negative impact on Gold, and vice-versa if it is weaker.
Technical Analysis: Gold declines to key trendline
Gold price (XAU/USD) has fallen to support from the dark-grey major trendline which reflects the uptrend since February.
Since the decline from the all-time highs, it is now probably in a short-term downtrend favoring short positions over longs.
XAU/USD Daily Chart
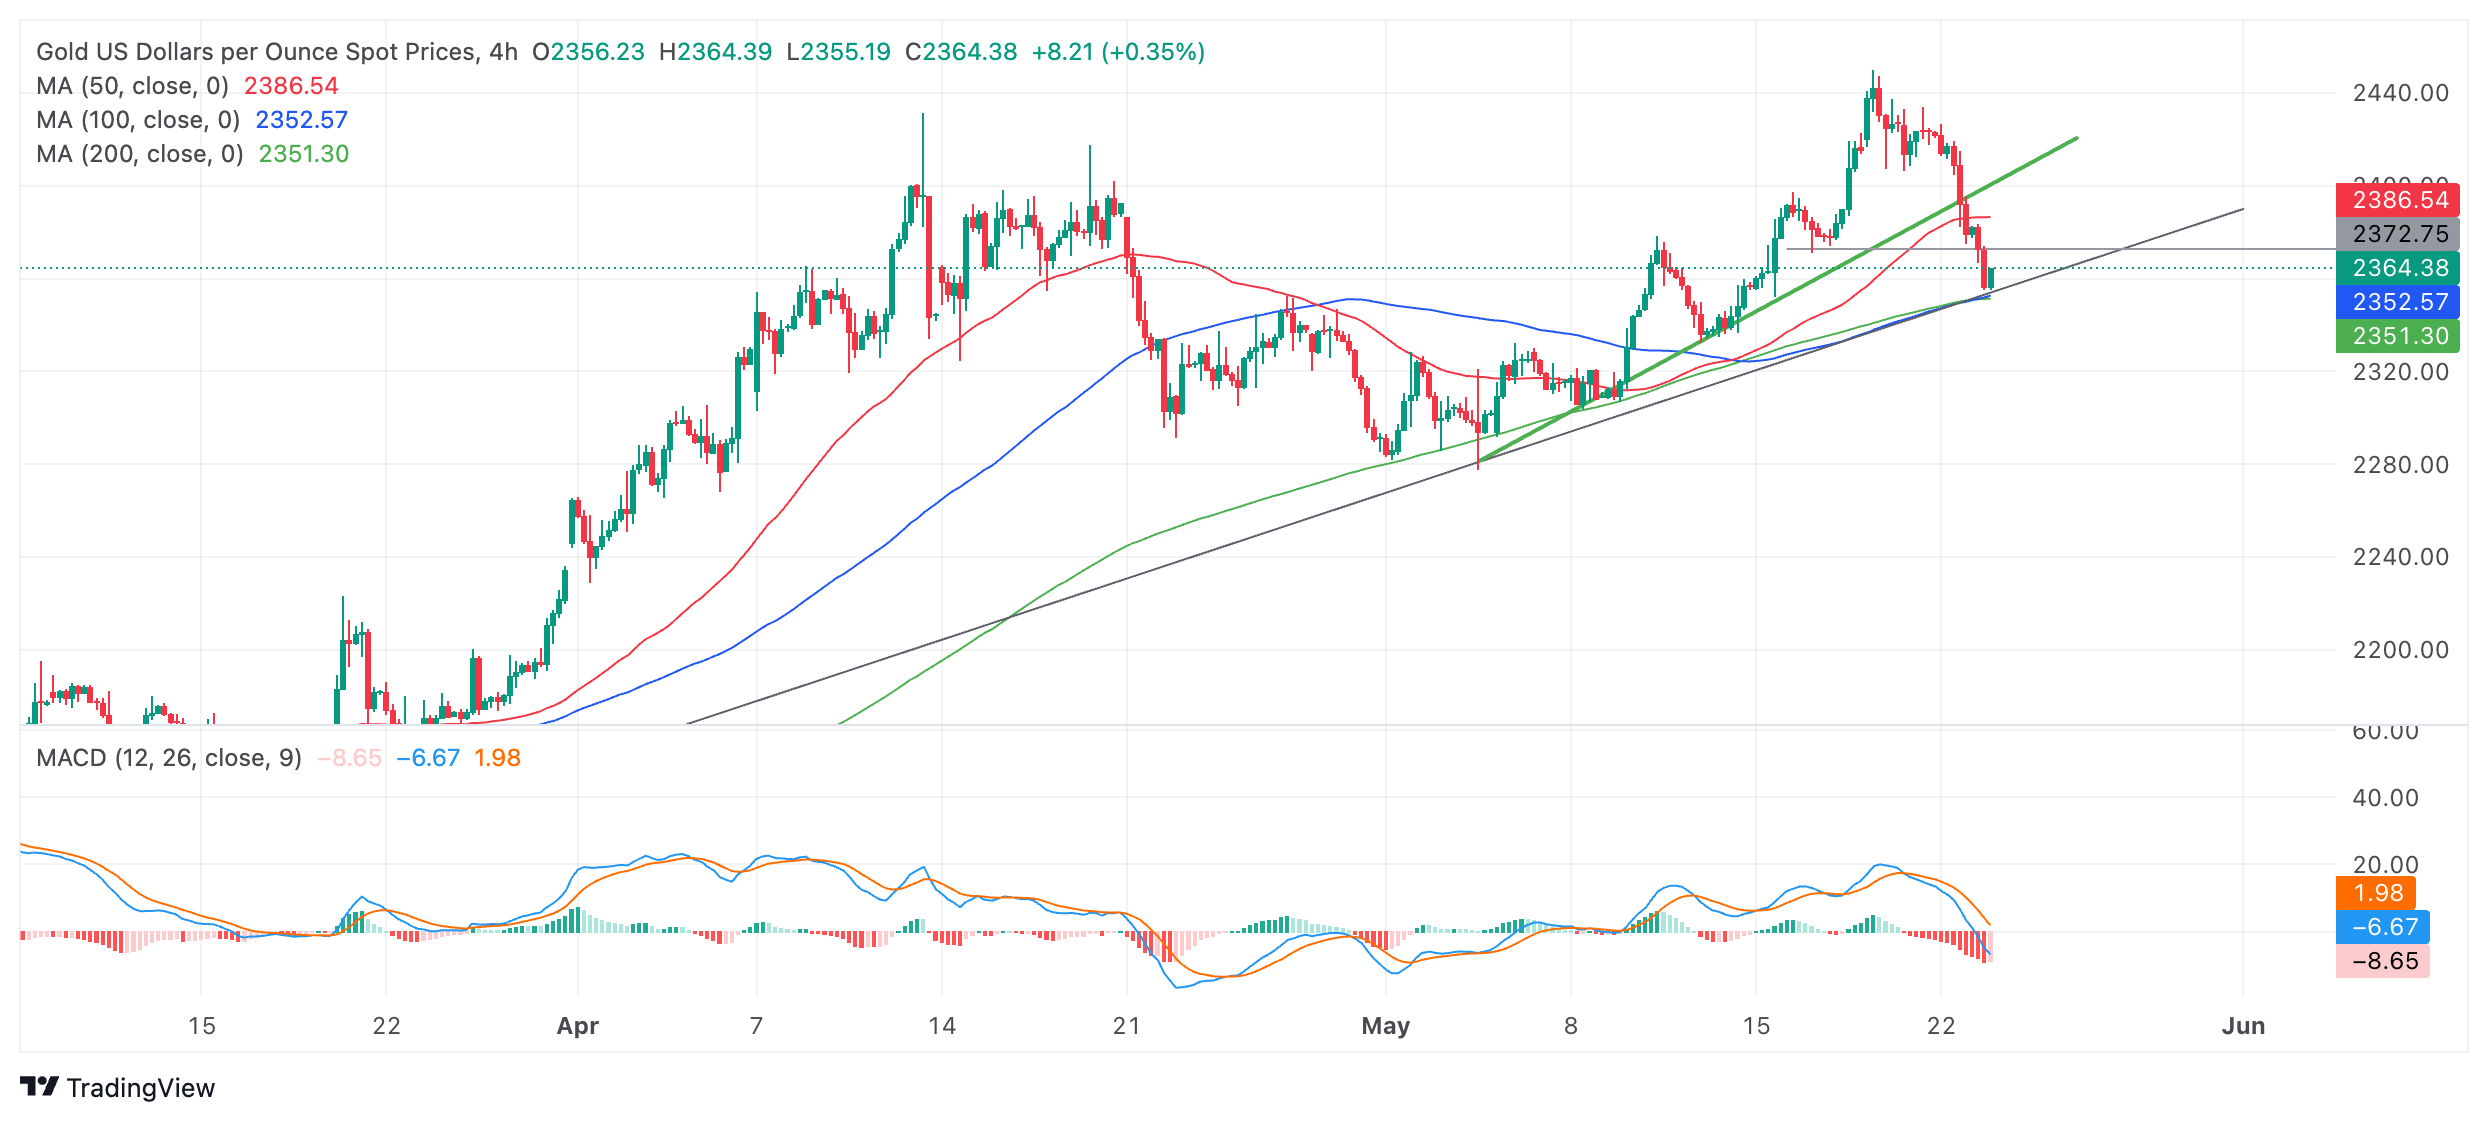
Gold price is currently pulling back from the trendline and if it continues higher, it could rise up to resistance at $2,371, the May 16 higher low. After that, however, it will probably roll over and continue falling in line with the short-term downtrend.
If Gold definitively breaks below the dark-grey trendline, it will be a very bearish sign. Such a move could then fall to a conservative target at $2,305 (Fibonacci 0.618 of the prior down move) or all the way down to $2,275 (100% of the prior down move).
A definitive break would be one accompanied by a long red candle that closes near its low or three red candles in a row that break below the trendline.
The precious metal’s medium and long-term trends are still bullish, however, and given the old adage that “the trend is your friend,” this suggests the risk of a recovery remains high. At the moment the only sign a recovery may evolve is that Gold has found support at a major trendline. There are no signs from price action, however, that a reversal is underway.
A break above the new $2,450 all-time high would confirm a continuation of the uptrend and a rally to the next target, probably at the psychologically significant $2,500 level.
Economic Indicator
FOMC Minutes
FOMC stands for The Federal Open Market Committee that organizes 8 meetings in a year and reviews economic and financial conditions, determines the appropriate stance of monetary policy and assesses the risks to its long-run goals of price stability and sustainable economic growth. FOMC Minutes are released by the Board of Governors of the Federal Reserve and are a clear guide to the future US interest rate policy.
Read more.Last release: Wed May 22, 2024 18:00
Frequency: Irregular
Actual: -
Consensus: -
Previous: -
Source: Federal Reserve
Minutes of the Federal Open Market Committee (FOMC) is usually published three weeks after the day of the policy decision. Investors look for clues regarding the policy outlook in this publication alongside the vote split. A bullish tone is likely to provide a boost to the greenback while a dovish stance is seen as USD-negative. It needs to be noted that the market reaction to FOMC Minutes could be delayed as news outlets don’t have access to the publication before the release, unlike the FOMC’s Policy Statement.
Recommended Articles


