

Silver Price Analysis: Meets key long-term resistance at $30.00

Source Fxstreet
  • Silver price has rallied up to just shy of $30.00, a key resistance level. 
  • The $30.00 barrier lies at the top of a four-year consolidation range. 
  • A breakout above would be a significant technical event for Silver. 

Silver (XAG/USD) price is rising up in an ascending channel and on Thursday reached just shy of the $30.00 mark, a significant resistance level. 

The precious metal is currently pulling back as traders book profits, however, it remains in a short-term uptrend, which given the old saying that “the trend is your friend” is likely to resume and continue pushing higher.

4-hour Chart 
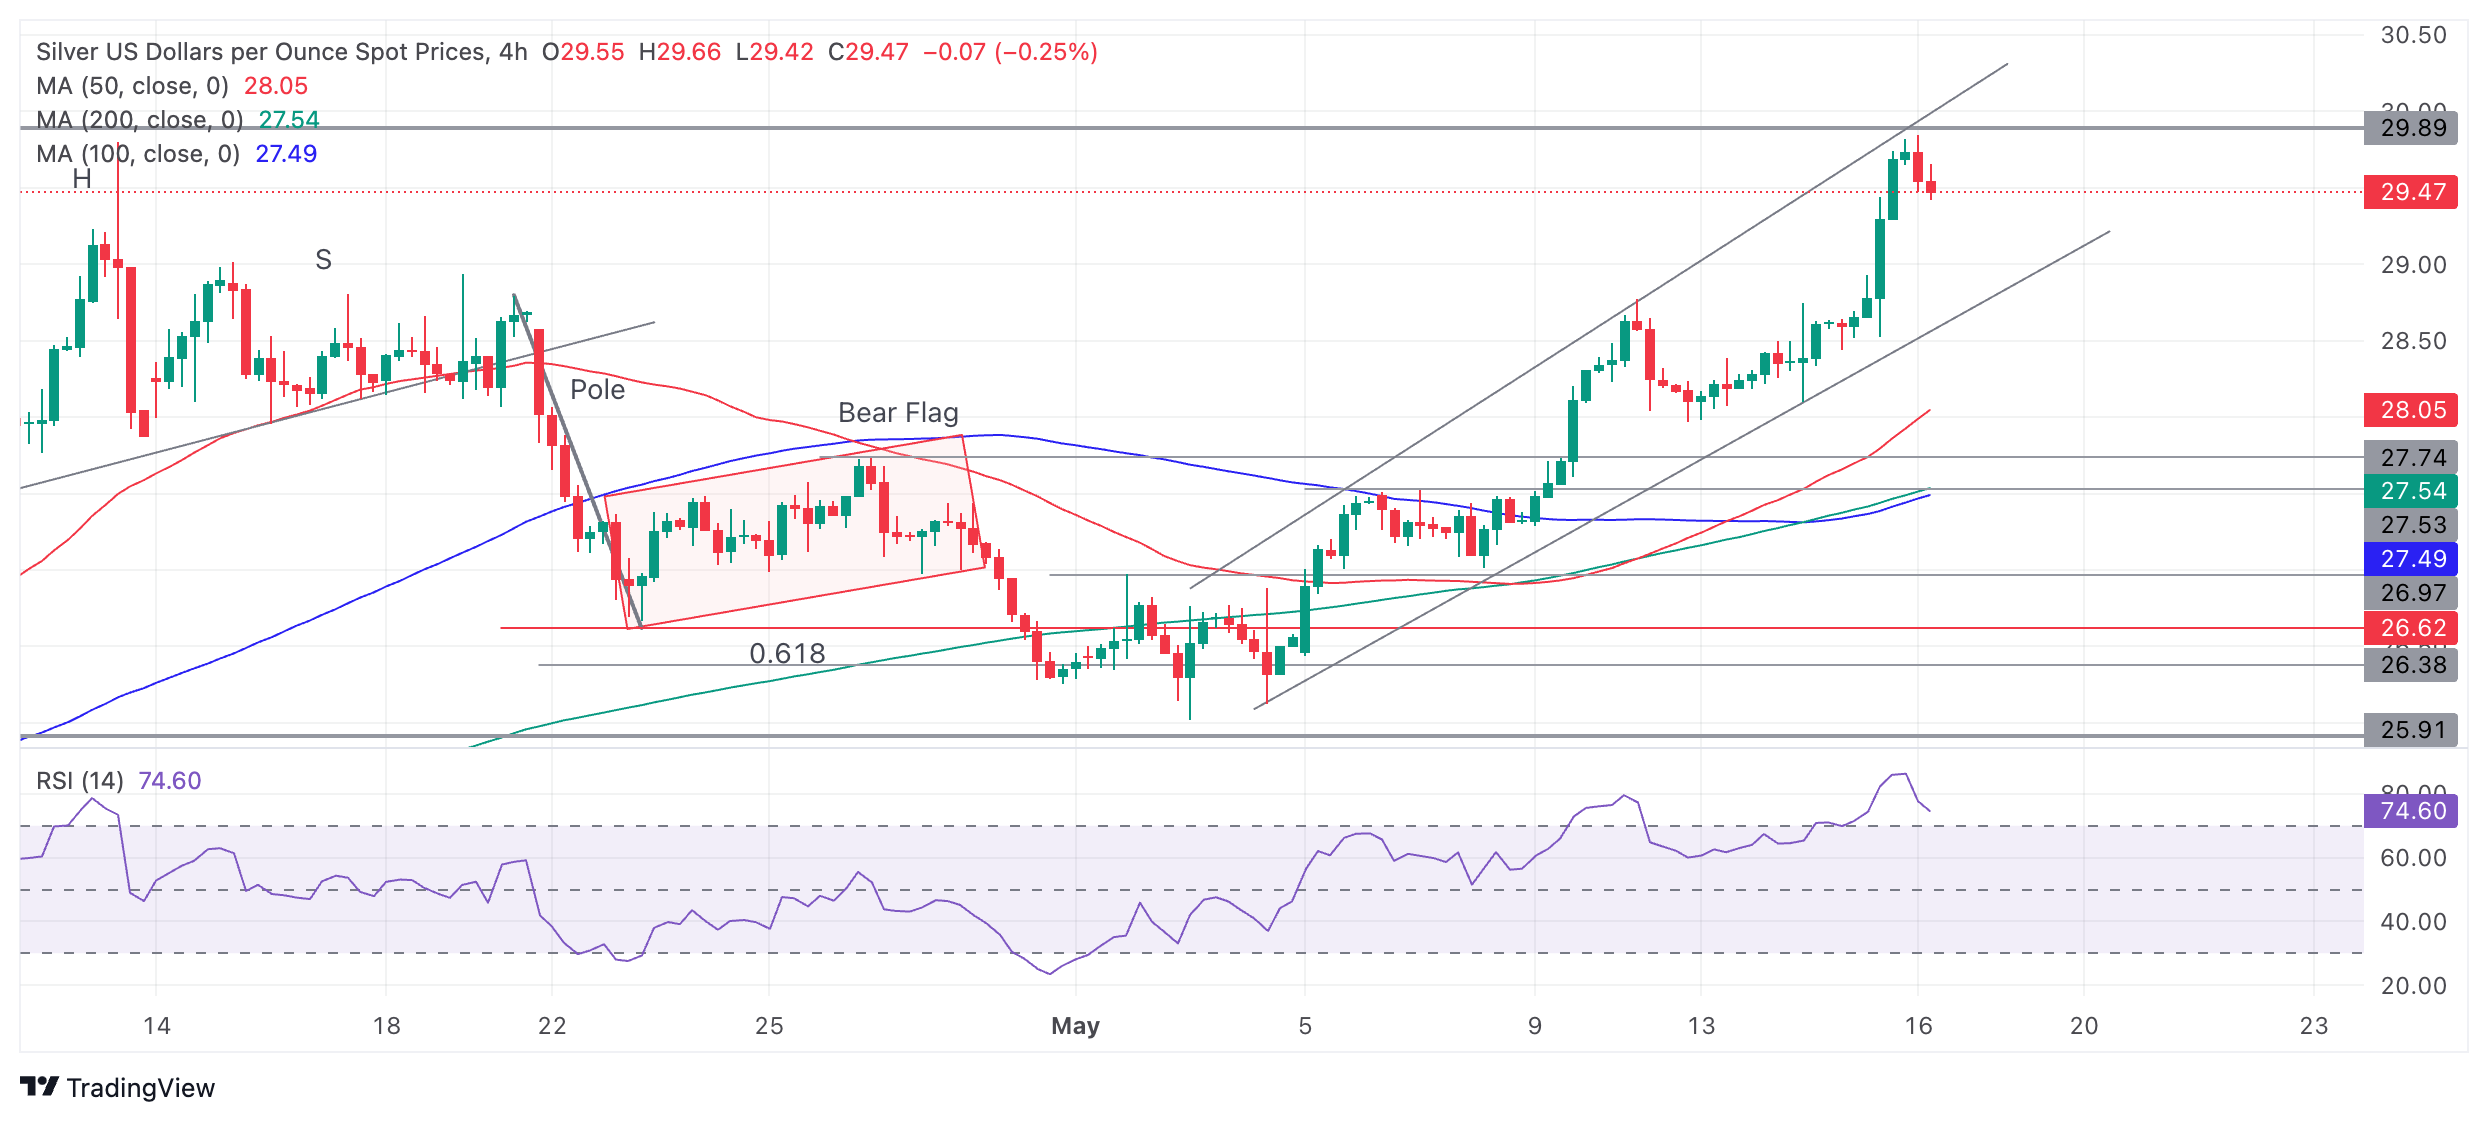


The Relative Strength Index (RSI) is in the overbought zone, suggesting traders should be cautious about adding longs to their bullish positions. If the RSI exits overbought on a closing basis it will signal a deeper correction is taking place. 

Eventually the short-term uptrend should reassert itself, however, and Silver price probably rally higher. Key long-term resistance for Silver lies at circa $30.00 which is likely to present a formidable barrier to further upside.

Silver Weekly Chart
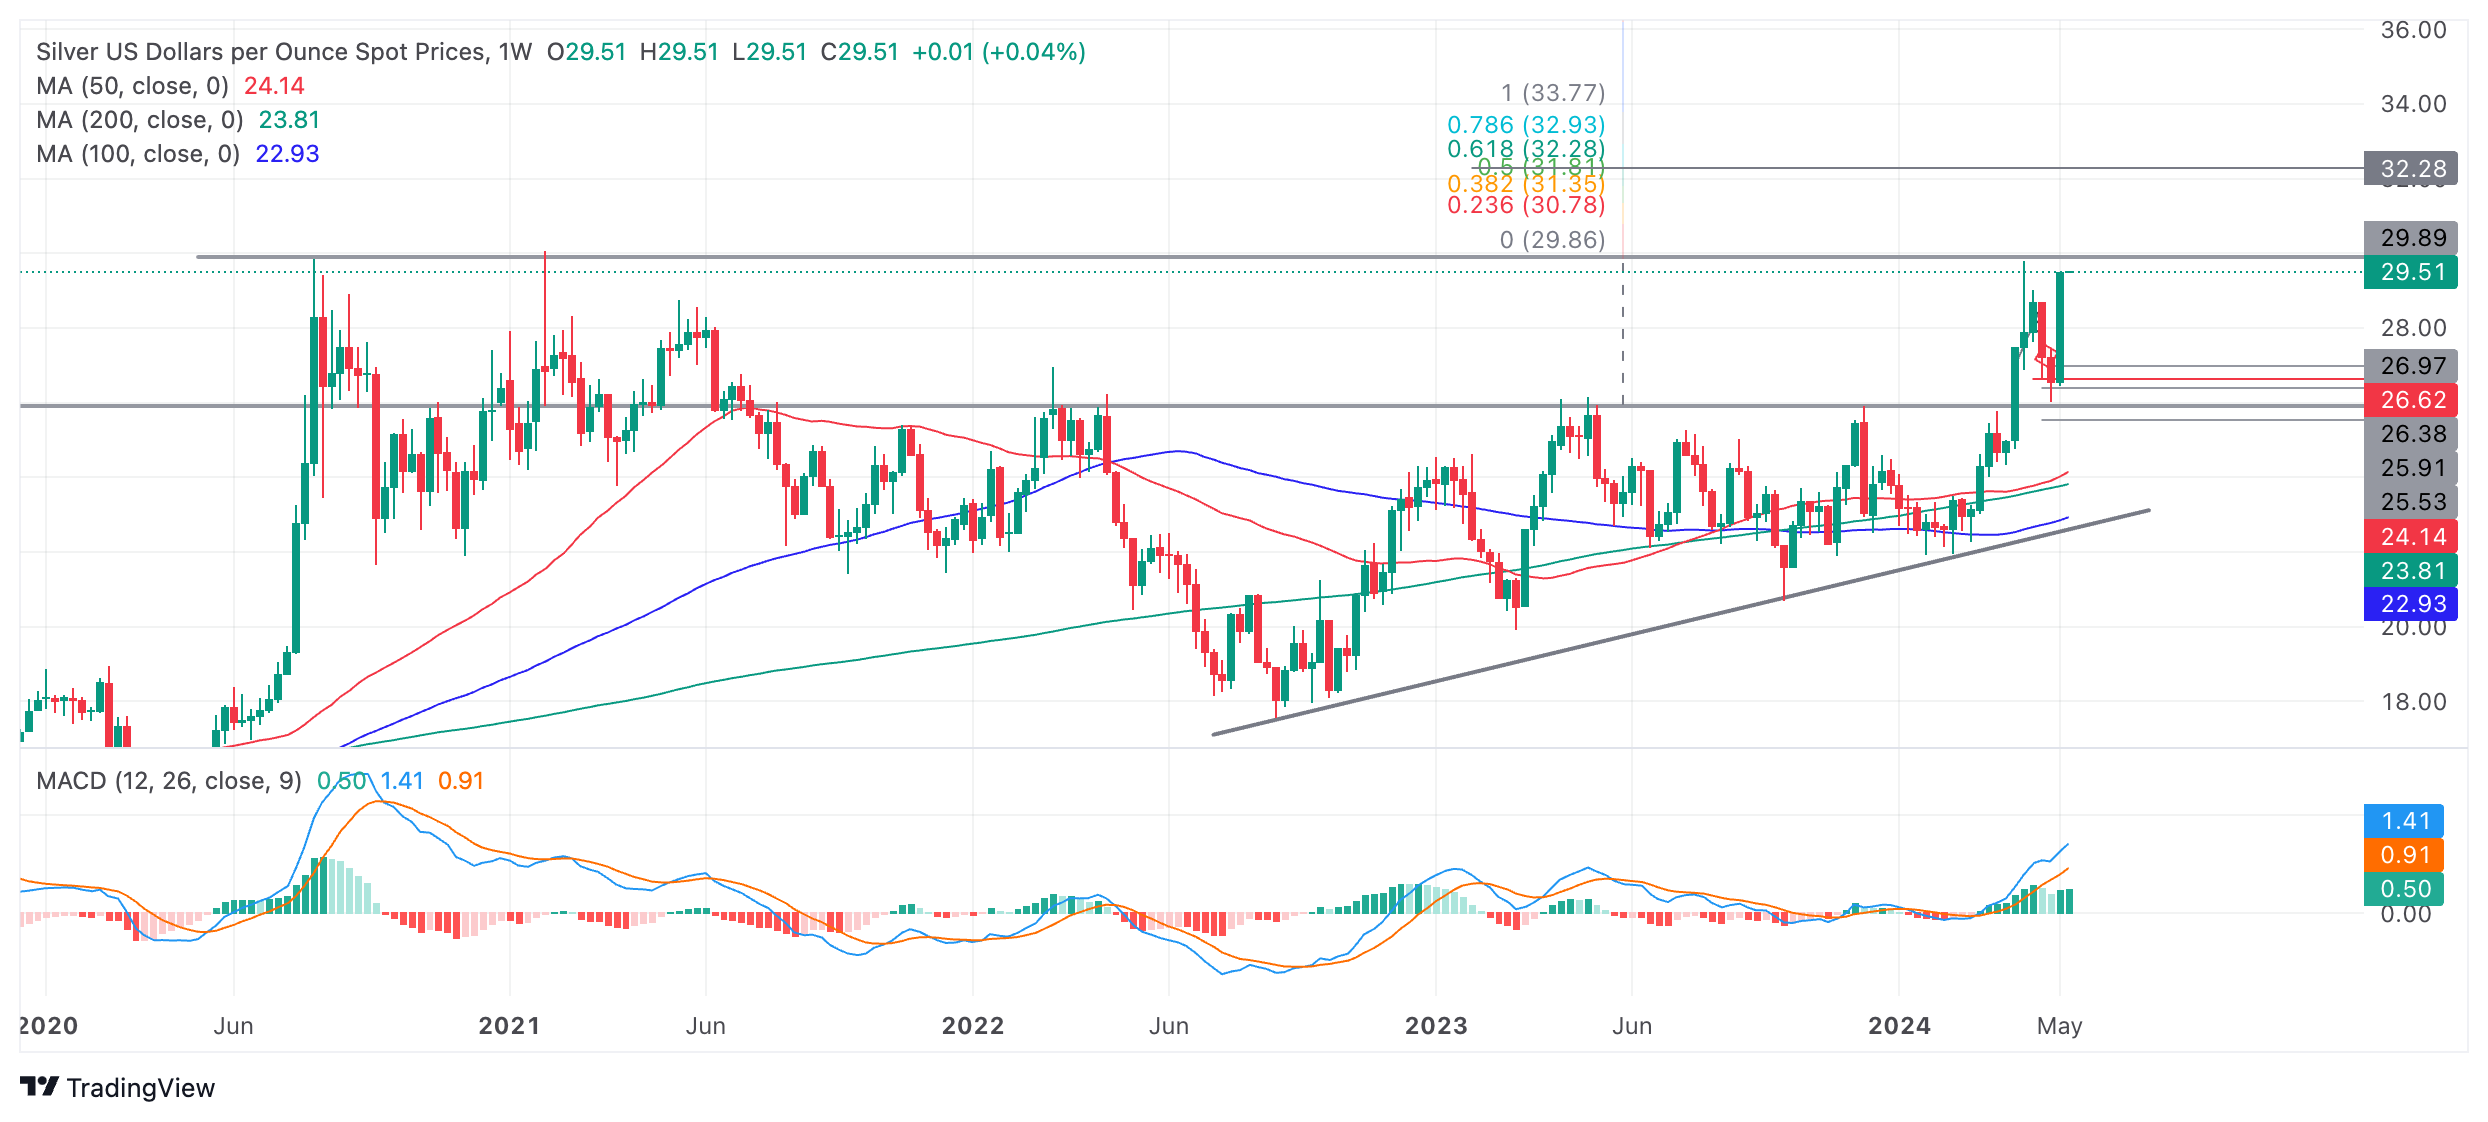
The importance of the $30.00 level can be seen more clearly on the weekly chart above, which shows the level has repeatedly been tested since 2020 when Silver’s long-term sideways consolidation began. 

This is the fourth time the level has been tested and it is possible that it will repel price once again, however, a decisive break above the level would probably lead to a volatile move higher. This is so because levels that have been repeatedly touched often generate volatile moves when they are finally penetrated.  

A decisive break above $30.00, therefore, would result in an extension of the short-term uptrend and a breakout from a four-year consolidation range. At a minimum such a move ought to reach $32.28, the Fibonacci 0.618 extension of the upper part of the consolidation range higher. This is only an estimate, however, and there is a possibility Silver could go much higher as confidence in the uptrend draws more bulls to the trade. If exuberance is high, $33.83 could be reached, followed even by $36.28, the 1.618 ratio extension of the height of the range.

It would require a decisive break below the rising channel lows at roughly $29.00 to bring the short-term uptrend into doubt and suggest the possibility of a more bearish outlook.

A decisive break would be one accompanied by a long red candlestick that closed near its lows or three red candlesticks in a row.


Disclaimer: For information purposes only. Past performance is not indicative of future results.
placeholder
My Top 5 Stock Market Predictions for 2026Five 2026 market predictions written in a native, news-style voice: AI’s winners and losers, broader sector leadership, dividend demand, valuation cooling as the Shiller CAPE sits at 39 (Dec. 31, 2025), and quantum-computing bursts—while keeping all original facts and numbers unchanged.
Author  Mitrade
Jan 06, Tue
Five 2026 market predictions written in a native, news-style voice: AI’s winners and losers, broader sector leadership, dividend demand, valuation cooling as the Shiller CAPE sits at 39 (Dec. 31, 2025), and quantum-computing bursts—while keeping all original facts and numbers unchanged.
placeholder
Financial Markets 2026: Volatility Catalysts in Gold, Silver, Oil, and Blue-Chip Stocks—A CFD Trader's OutlookGet a comprehensive financial market 2026 outlook exploring key economic drivers, volatility catalysts in gold, oil and stocks, and what the evolving economic outlook means for cfd trading strategies and risk management on global markets.
Author  Rachel Weiss
May 15, Fri
Get a comprehensive financial market 2026 outlook exploring key economic drivers, volatility catalysts in gold, oil and stocks, and what the evolving economic outlook means for cfd trading strategies and risk management on global markets.
placeholder
Gold Price Forecast: Can Gold Keep Rising After Reclaiming $4,400 as Markets Await Upcoming CPI Data?During Wednesday's Asian trading session, spot gold (XAUUSD) extended its rebound, reclaiming $4,400/oz. As of 11:08 Beijing time on August 12, spot gold was trading at $4,414.705/oz, up
Author  TradingKey
Aug 12, Wed
During Wednesday's Asian trading session, spot gold (XAUUSD) extended its rebound, reclaiming $4,400/oz. As of 11:08 Beijing time on August 12, spot gold was trading at $4,414.705/oz, up
placeholder
WTI declines below $82.50 as oil inventories rise far more than expectedWest Texas Intermediate (WTI), the US crude oil benchmark, is trading around $82.45 during the early Asian trading hours on Thursday. WTI declines on a larger-than-expected build in US crude oil inventories. Traders will closely monitor the developments surrounding US-Iran talks for fresh impetus. 
Author  FXStreet
Aug 13, Thu
West Texas Intermediate (WTI), the US crude oil benchmark, is trading around $82.45 during the early Asian trading hours on Thursday. WTI declines on a larger-than-expected build in US crude oil inventories. Traders will closely monitor the developments surrounding US-Iran talks for fresh impetus. 
placeholder
WTI remains below $80.50 as traders monitor diplomatic efforts to reopen HormuzWest Texas Intermediate (WTI) oil price remains subdued for the third successive day, trading around $80.30 per barrel during the Asian hours on Friday. Crude oil prices edge lower as investors adopt a wait-and-see approach, closely monitoring diplomatic attempts to reopen the Strait of Hormuz.
Author  FXStreet
Yesterday 01: 20
West Texas Intermediate (WTI) oil price remains subdued for the third successive day, trading around $80.30 per barrel during the Asian hours on Friday. Crude oil prices edge lower as investors adopt a wait-and-see approach, closely monitoring diplomatic attempts to reopen the Strait of Hormuz.
Related Instrument
goTop
quote