


Gold finds a floor as geopolitical risk catalyzes demand
- Gold finds its feet amid continued geopolitical risk aversion.
- Demand from investors including central banks due to Gold’s safe-haven qualities remains high.
- XAU/USD finds support and remains in a short-term uptrend, indicating it could recover.
Gold price (XAU/USD) stabilizes in the $2,330s on Tuesday as geopolitical risks continue to stoke demand for the safe-haven asset.
Gains may be capped, however, after data out of the US indicated interest rates will probably remain elevated for some time yet, reducing the attractiveness of the non-yielding precious metal.
Gold price finds a floor on geopolitical risks
Gold price finds a floor on Tuesday as rising geopolitical risks prime demand for the safe-haven asset.
Increasing protests against Israel’s occupation of Gaza, Russia’s opening up of a new front in Ukraine, as well as fears of a fragmentation in global trade have lifted the “threat-level” of geopolitical risk up a notch.
IMF warns that global trade is at risk
In a speech to the Stanford Institute for Economic Policy Research on Monday, Gita Gopinath, the First Deputy Managing Director of the IMF warned: “Countries are reevaluating their trading partners based on economic and national security concerns,” adding that if the trend continued, “we could see a broad retreat from global rules of engagement and, with it, a significant reversal of the gains from economic integration.”
Western and US sanctions against Russia, Iran and other emerging market nations are a factor in the “fragmentation” of trade alliances along geopolitical lines. The response by investors and central banks is to horde Gold.
Golden alternative to the US Dollar
The move by BRICs nations away from the use of the US Dollar as the medium of international trade has increased demand for Gold as a possible replacement.
This has been the main reason for the surge in non-Western central bank demand for Gold and a corresponding reduction in US Dollar reserves.
Gold is seen as a possible replacement for the US Dollar as a safe store of value in international trade deals between nations with volatile domestic currencies, according to Carnegie Endowment for International Peace, an advisory service based in Washington.
Gold capped by US data
Gold price upside may be capped, however, following survey data from the Reserve Bank of New York which showed US consumers still expect shop prices to rise over the next year. The data indicates the Federal Reserve (Fed) might have to keep interest rates elevated for longer to wrestle inflation down.
NY Consumer Sentiment in April, released on Monday, showed one-year-ahead inflation expectations rose to 3.3%, from 3.0% in March, the level it had been at since November 2023. The reading is well above the 2.0% target of the Federal Reserve and makes it likely the Fed will keep interest rates higher for longer.
Since Gold is a non-interest-bearing asset it’s a less attractive option when real interest rates are high.
Real interest rates – or interest investors can get minus inflation – remain relatively high according to data from the Federal Reserve Bank of Cleveland, increasing the opportunity-cost of holding non-yielding assets such as Gold.
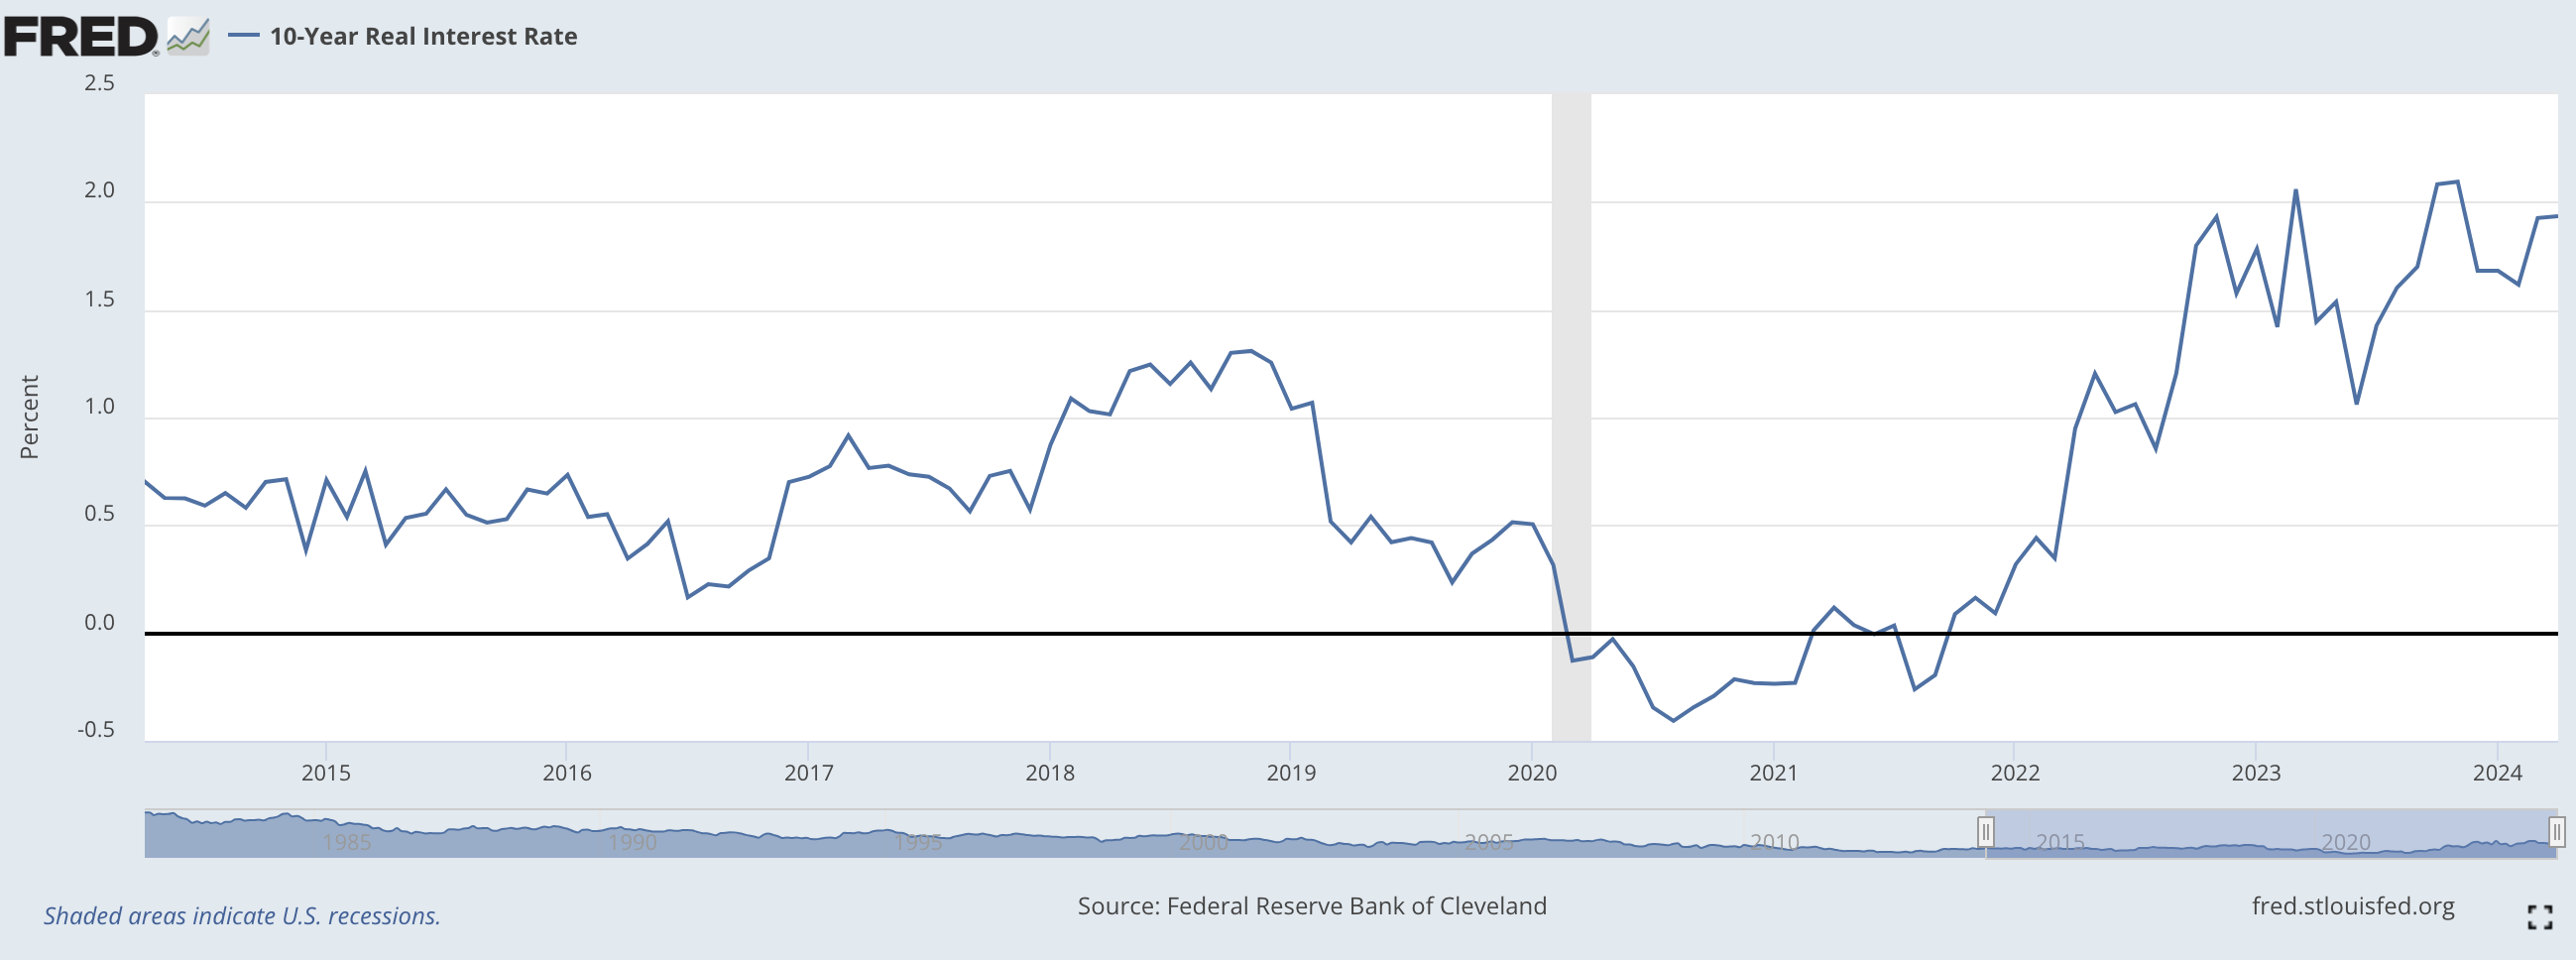
10-Year Real Interest Rate. Source: Federal Reserva Bank of Cleveland
Technical Analysis: Gold price finds support after backslide
Gold price (XAU/USD) has found a floor after backsliding over recent sessions.
Gold broke below major support from previous highs at around $2,350 but has since found support just above another set of highs at around $2,330.
XAU/USD 4-hour Chart
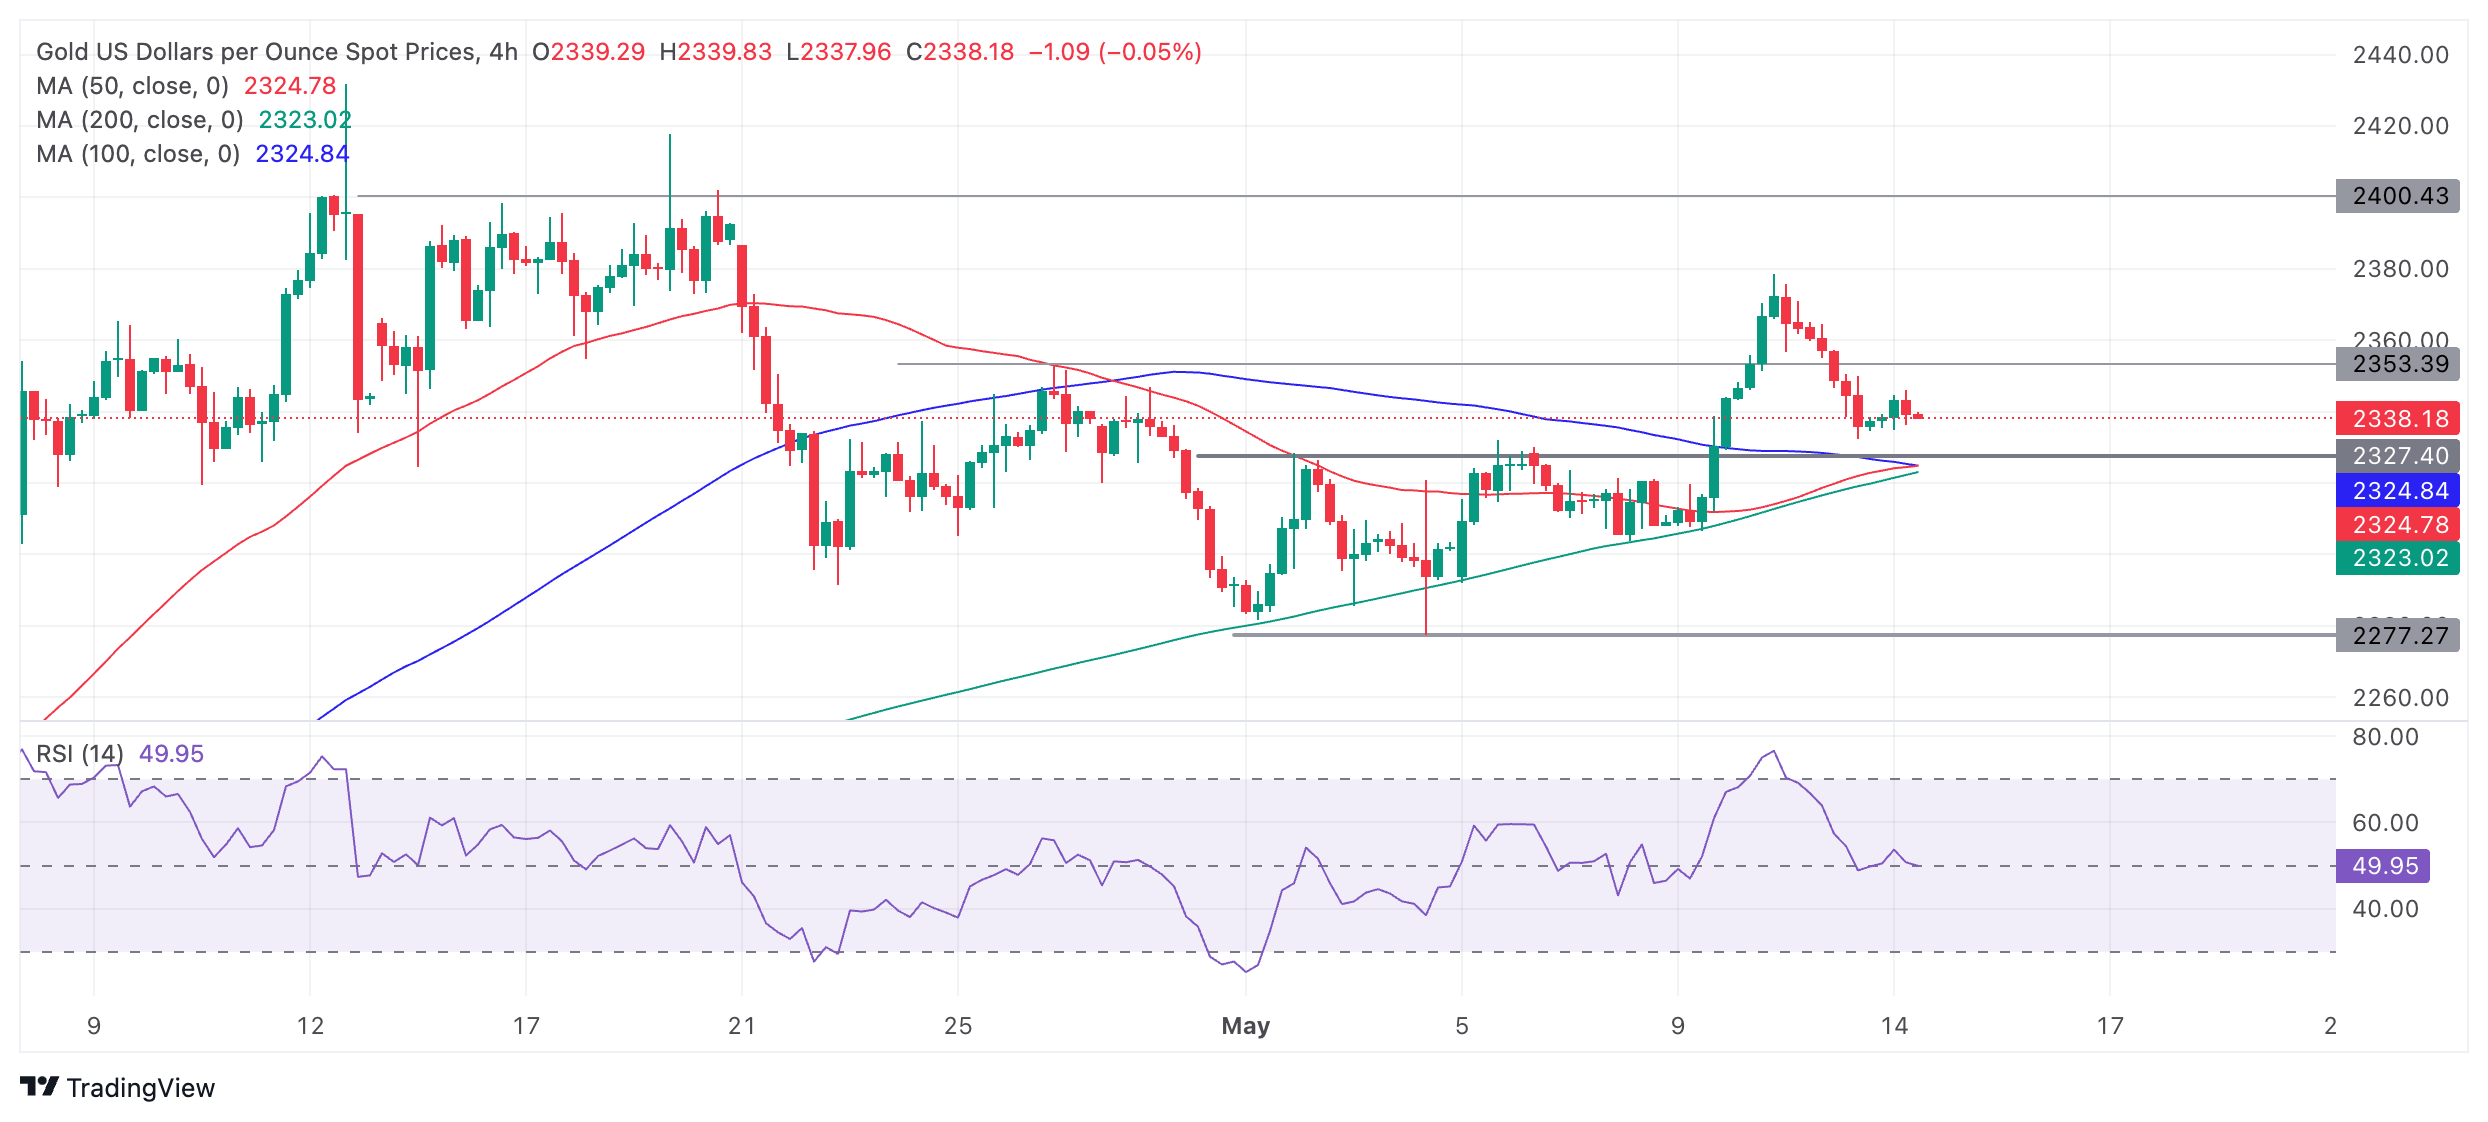
Despite the steep correction, the precious metal remains in a bullish short-term trend, which given the old saying “the trend is your friend”, is likely to resume and push prices higher again. There are no signs yet the uptrend is resuming, although bearish momentum on the pullback has petered out for now.
Assuming the uptrend does resume, the next target for Gold would be at around $2,400, roughly at the April highs. A breakback above the $2,378 May 10 high would provide confirmation.
The medium and long-term charts (daily and weekly) are also bullish, adding a supportive backdrop for Gold.
Gold FAQs
Gold has played a key role in human’s history as it has been widely used as a store of value and medium of exchange. Currently, apart from its shine and usage for jewelry, the precious metal is widely seen as a safe-haven asset, meaning that it is considered a good investment during turbulent times. Gold is also widely seen as a hedge against inflation and against depreciating currencies as it doesn’t rely on any specific issuer or government.
Central banks are the biggest Gold holders. In their aim to support their currencies in turbulent times, central banks tend to diversify their reserves and buy Gold to improve the perceived strength of the economy and the currency. High Gold reserves can be a source of trust for a country’s solvency. Central banks added 1,136 tonnes of Gold worth around $70 billion to their reserves in 2022, according to data from the World Gold Council. This is the highest yearly purchase since records began. Central banks from emerging economies such as China, India and Turkey are quickly increasing their Gold reserves.
Gold has an inverse correlation with the US Dollar and US Treasuries, which are both major reserve and safe-haven assets. When the Dollar depreciates, Gold tends to rise, enabling investors and central banks to diversify their assets in turbulent times. Gold is also inversely correlated with risk assets. A rally in the stock market tends to weaken Gold price, while sell-offs in riskier markets tend to favor the precious metal.
The price can move due to a wide range of factors. Geopolitical instability or fears of a deep recession can quickly make Gold price escalate due to its safe-haven status. As a yield-less asset, Gold tends to rise with lower interest rates, while higher cost of money usually weighs down on the yellow metal. Still, most moves depend on how the US Dollar (USD) behaves as the asset is priced in dollars (XAU/USD). A strong Dollar tends to keep the price of Gold controlled, whereas a weaker Dollar is likely to push Gold prices up.
Recommended Articles


