CFDs are complex instruments and come with a high risk of losing money rapidly due to leverage. You should consider whether you understand how CFDs work and whether you can afford to take the high risk of losing your money.
    Mitrade Insights is dedicated to providing investors with rich, timely and most valuable financial information to help investors grasp the market situation and find timely trading opportunities.
    2021
    Best News & Analysis Provider
    FxDailyInfo
    2022
    Best Forex Educational Resources Global
    International Business Magazine

    Silver Price Analysis: Silver price could be forming a Bear Flag price pattern

    Source Fxstreet
    Apr 25, 2024 13:35
    • Silver price may have formed a Bear Flag pattern on the 4-hour chart. 
    • The pattern suggests a continuation of the bearish trend to targets substantially lower. 
    • Support from a relic of long-term support and resistance at $25.80 is likely to provide a floor for any sell-off. 

    Silver (XAG/USD) price may have formed a Bear Flag pattern on the 4-hour chart which bodes ill for the precious metal’s price going forward. 

    4-hour Chart 
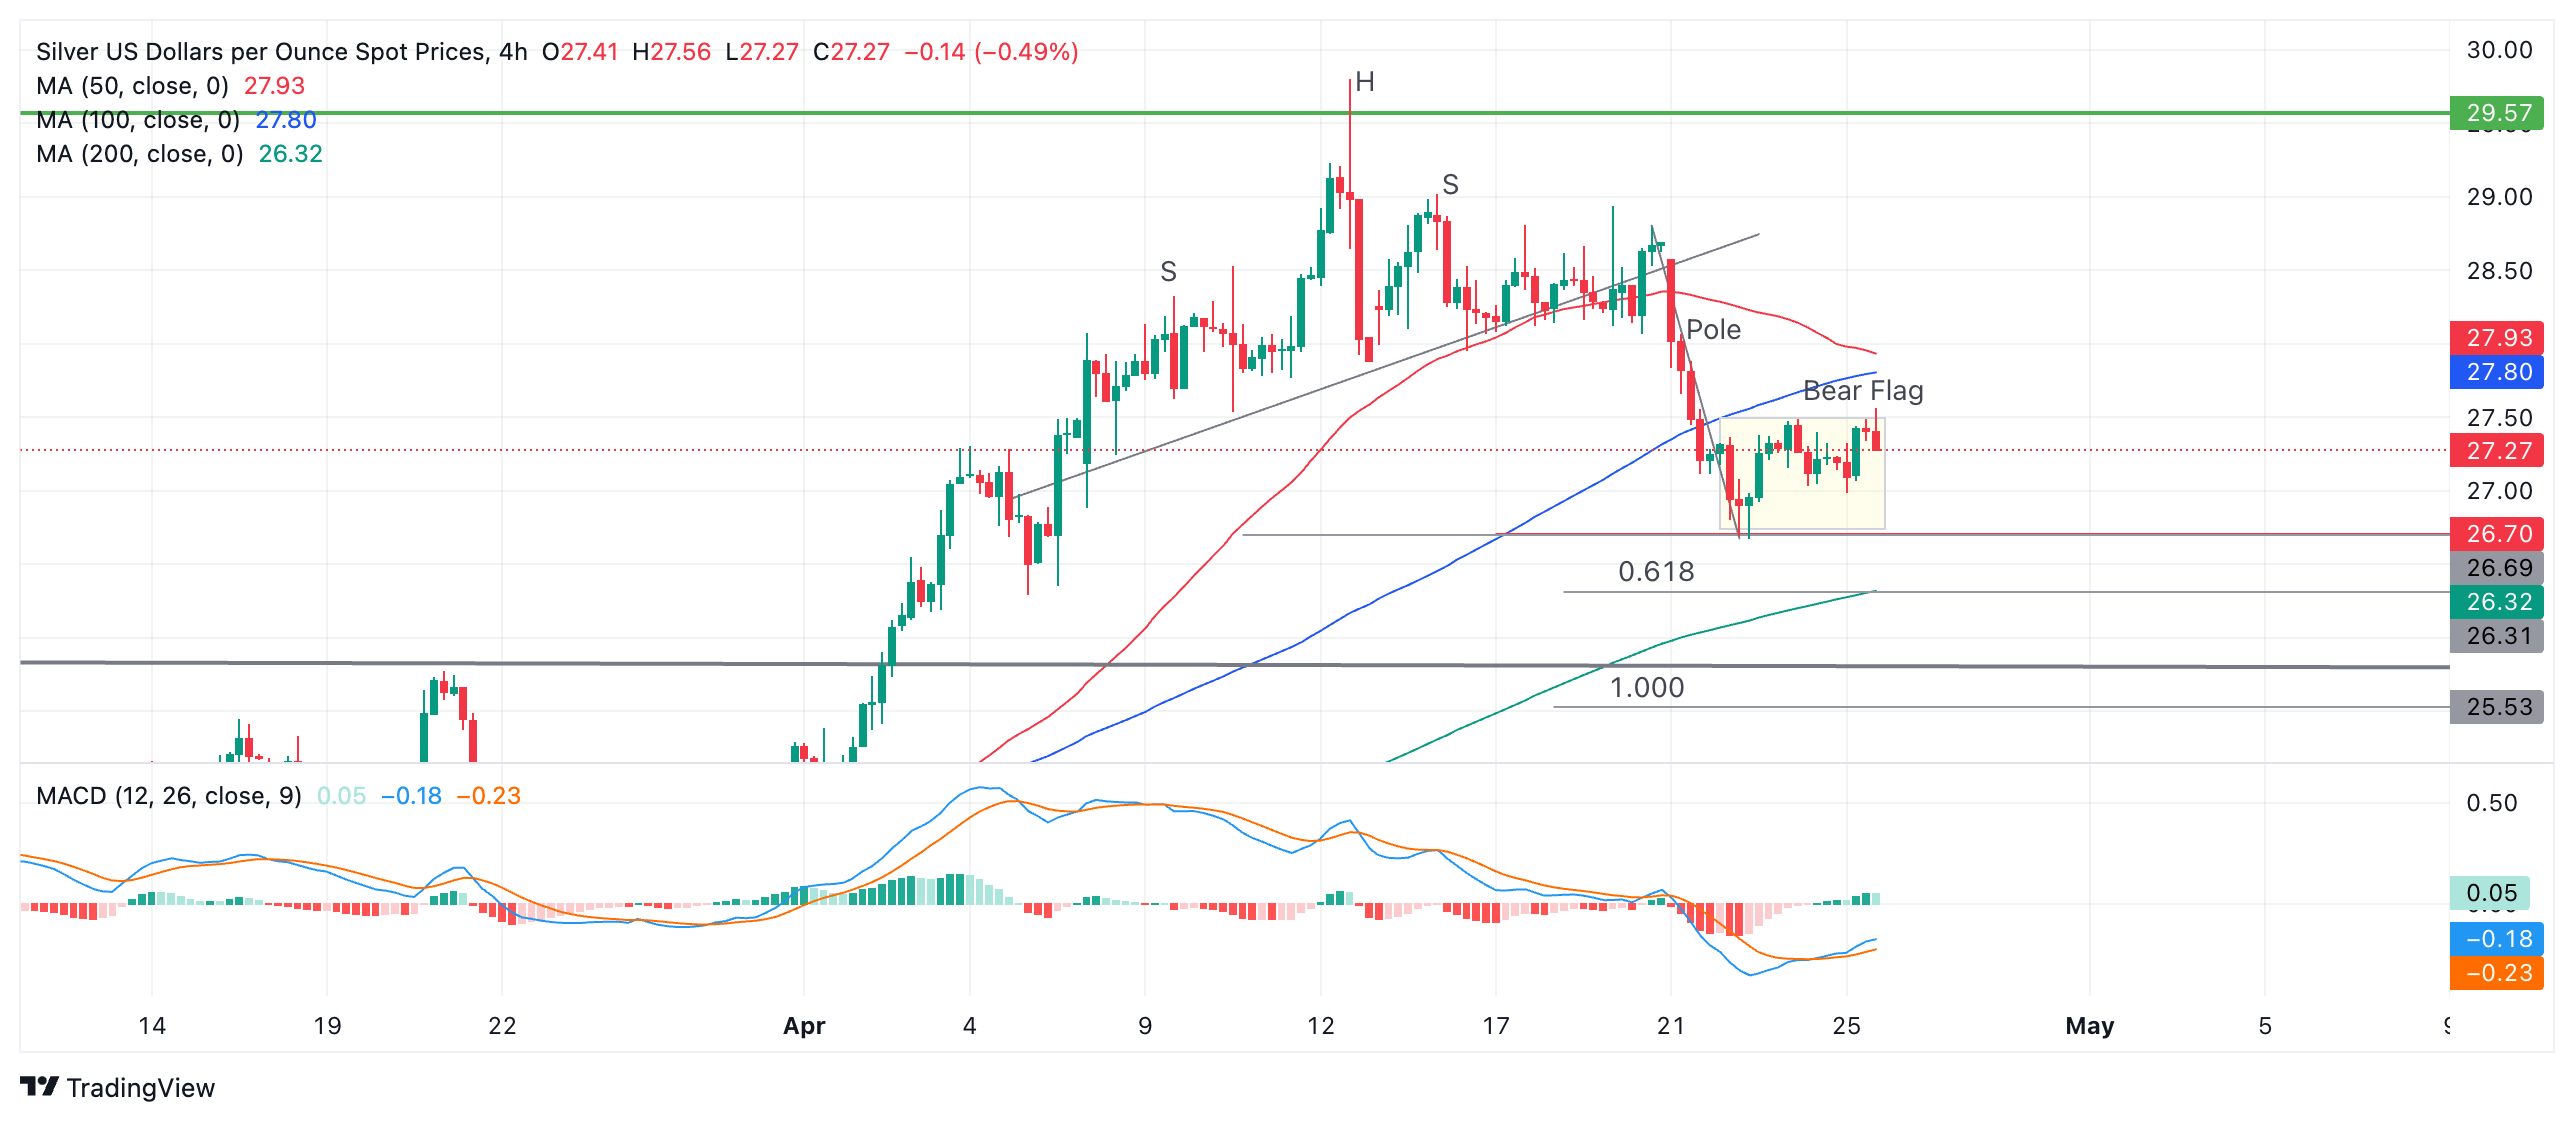
    After forming a multiple shouldered Head and Shoulders (H&S) topping pattern at the $30.00 highs of mid-April, Silver price declined to the initial target for the pattern at $26.70. This target was the conservative estimate for the pattern, calculated by taking the height of the H&S and extrapolating the distance by its 0.618 Fibonacci ratio from the neckline underpinning the pattern lower. 

    After bouncing from a temporary floor at $26.70 Silver price has consolidated forming a rectangle pattern. Taken together with the prior sharp decline the whole formation resembles a Bear Flag pattern.  

    According to technical lore, the expected move down from a Bear Flag equals the length of the preceding “pole” or a Fibonacci ratio of the pole. In this case the pole is the decline that followed the completion of the H&S pattern. 

    The Fibonacci 0.618 ratio of the pole on Silver, when extrapolated lower, gives a conservative target at $26.31. If Silver price falls the whole length of the pole (Fib. 1.000), however, it will reach a more "optimistic" target of $25.53. 

    Tough support from a long-term upper range boundary line at $25.80, however, is likely to offer support before Silver price reaches the lower target for the Bear Flag. 

    A break below the $26.69 low of April 23 would be required to confirm a breakdown of the Bear Flag towards its targets. 


    Disclaimer: For information purposes only. Past performance is not indicative of future results.
    placeholder
    Silver price today: Silver declines, according to FXStreet dataSilver prices (XAG/USD) fell on Thursday, according to FXStreet data.
    Source  Fxstreet
    Silver prices (XAG/USD) fell on Thursday, according to FXStreet data.
    placeholder
    Silver Price Analysis: Trading at the top of a four-year consolidation zoneSilver (XAG/USD) has broken out of the narrow range it was trapped in since the start of 2023, which ran from between roughly $21.00 and $26.00, and risen up to the top of a larger consolidation.
    Source  Fxstreet
    Silver (XAG/USD) has broken out of the narrow range it was trapped in since the start of 2023, which ran from between roughly $21.00 and $26.00, and risen up to the top of a larger consolidation.
    placeholder
    Silver Price Analysis: XAG/USD climbs closer to mid-$28.00s, remains below YTD top set on FridaySilver (XAG/USD) catches fresh bids on the first day of a new week and stalls its retracement slide from the vicinity of the $29.80 region, or the highest level since February 2021 touched on Friday.
    Source  Fxstreet
    Silver (XAG/USD) catches fresh bids on the first day of a new week and stalls its retracement slide from the vicinity of the $29.80 region, or the highest level since February 2021 touched on Friday.
    goTop
    quote