

WTI churns close to $82.00 as Crude Oil tries to stop the slide
- Energy market tensions are receding after Iran, Israel trade blows.
- Fears of an escalating Middle East war are slipping back after Iran blinks.
- US supplies continue to outpace demand, limiting topside supply crunch.
Iran eased off the gas pedal on Monday, stating that it will not retaliate further against Israel following a back-and-forth scuffle between the two countries that sent global energy markets spiraling in recent weeks as fears of a widening Middle East conflict widened. Iran’s current de-escalation has given barrel markets a breather, and prices have slid back as market tensions ease.
West Texas Intermediate (WTI) US Crude Oil is exploring the low side of the $82.00 handle after declining from a near-term peak near $87.00. US Crude Oil barrels have slipped 6%, but still remain up nearly 15% in 2024.
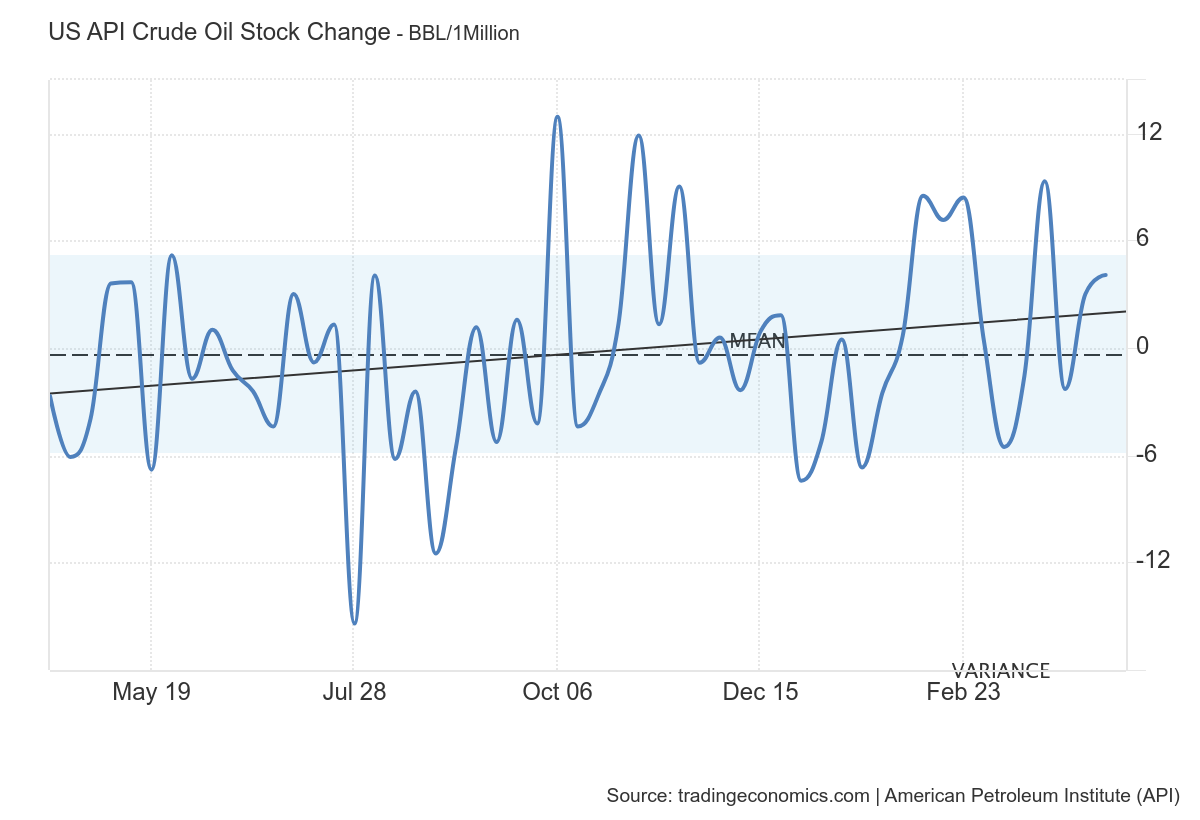
The American Petroleum Institute (API) will deliver its latest weekly Crude Oil Stocks barrel counts late Tuesday. US Crude reserves continue to defy gravity despite broad expectations of steep supply constraints in energy markets. US API barrel counts have been trending higher overall for some time.
WTI Crude Oil technical outlook
Geopolitical tensions continue to expose Crude Oil prices to upside volatility, but prices have continued to drift into the low end in the near term. Intraday action is on the bearish side of the 200-hour Exponential Moving Average (EMA) near $83.30. The $81.00 handle continues to act as an interim floor for price action, with bidders unable to reclaim territory above $82.00.
Despite declining for all but three of the last 12 consecutive trading days, US Crude Oil continues to trade above the 200-day EMA near $79.00. An extended backslide will see WTI challenging the first quarter’s congestion zone around the $78.00 handle.
WTI hourly chart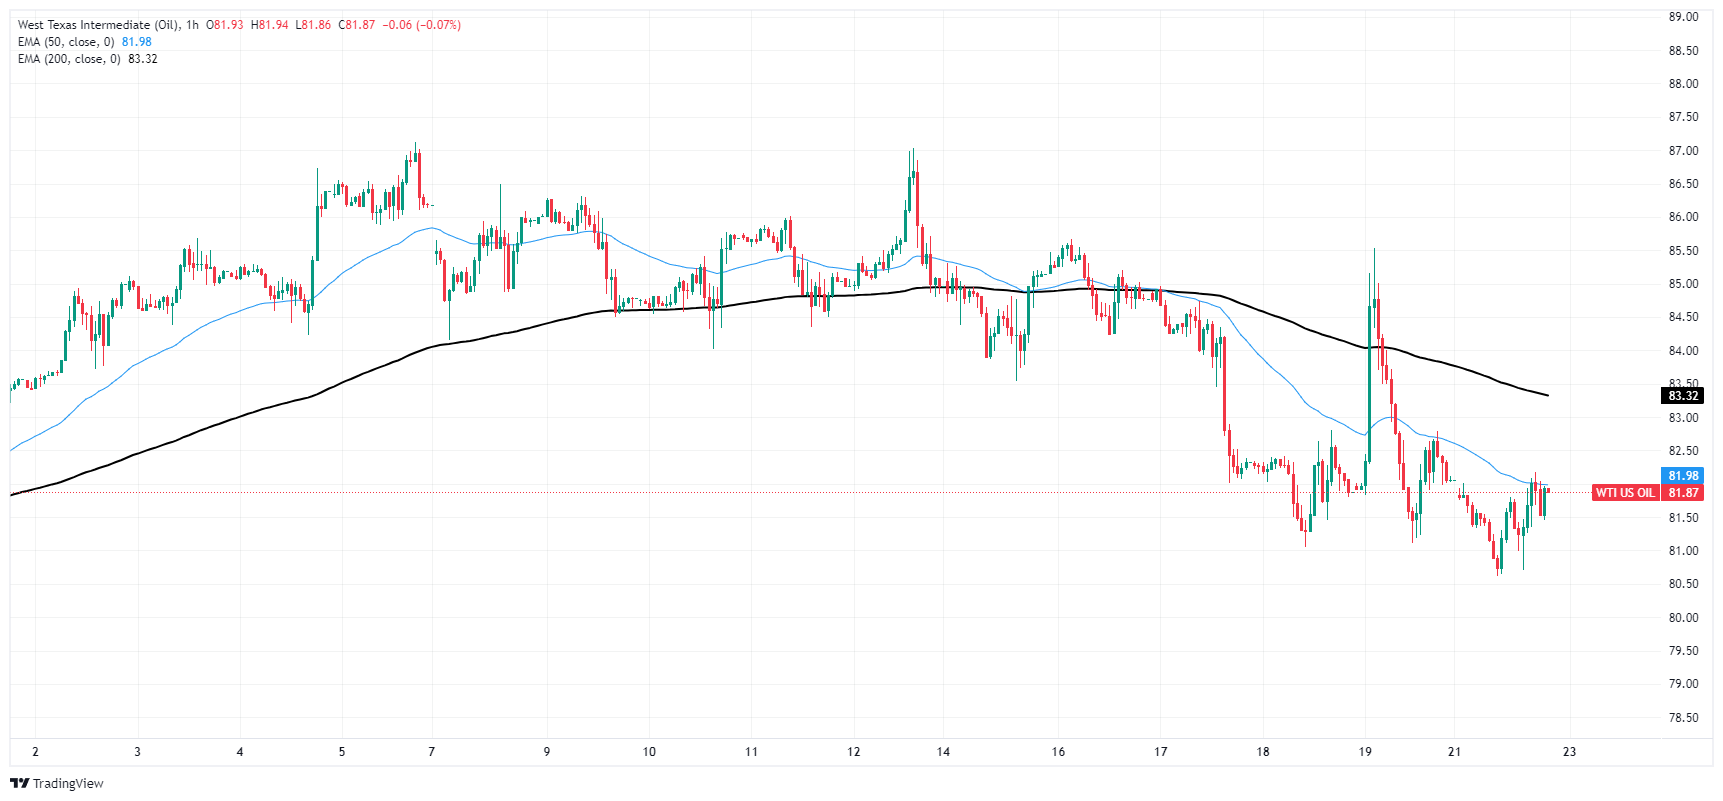
WTI daily chart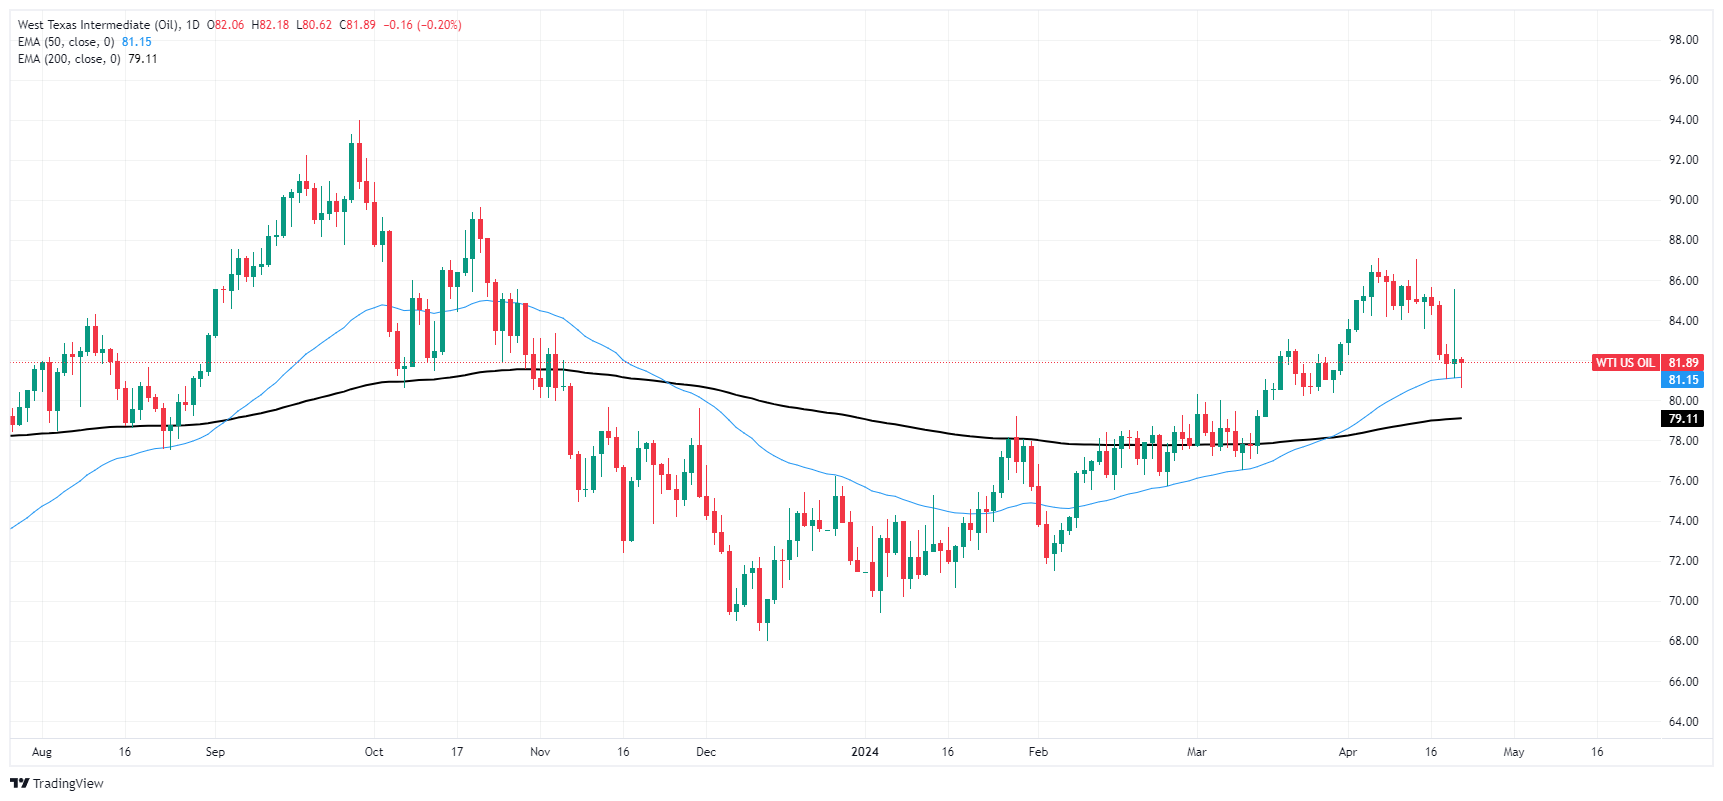
Recommended Articles


