Silver Price Forecast: XAG/USD rallies to $28.60 with eyes on Middle East tensions

Source Fxstreet
  • Silver price jumps higher to $28.60, driven by worsening geopolitical tensions.
  • Israel’s response to Iran’s attack will escalate fears of Middle East tensions spreading beyond Gaza.
  • US bond yields edge down despite Fed lean towards higher interest rates for a longer period.

Silver price (XAG/USD) advances to $28.60 in Wednesday’s early New York session. The white metal witnesses significant buying interest as deepening Middle East tensions keep safe-haven bid firm. Investors are worried that tensions in the Middle East region could spread beyond Gaza as Israel said it will respond to Iran’s attack on their territory.

The Iranian military launched hundreds of missiles and drones on Saturday in retaliation to Israel’s attack on the Iranian embassy near Damascus in Syria in which two high-rank generals were killed. After Iran’s attack on Israel Tehran said, “the matter deemed to be closed.” However, should the Israeli regime make another mistake, Iran’s response will be considerably more severe, Wall Street Journal reported. The appeal for bullions strengthens when investors see geopolitical tensions escalating further.

Meanwhile, 10-year US Treasury yields fall to 4.63% despite Federal Reserve (Fed) sees interest rates remaining higher for a longer period. A decline in yields on interest-bearing assets eases the opportunity cost of holding an investment in non-yielding assets, such as Silver.

The US Dollar Index (DXY) exhibits strength near 106.20 as robust US Retail Sales data for March has improved the economic outlook. Higher spendings by households are done when labor market conditions remain tight, suggest strong economic outlook.

Silver technical analysis

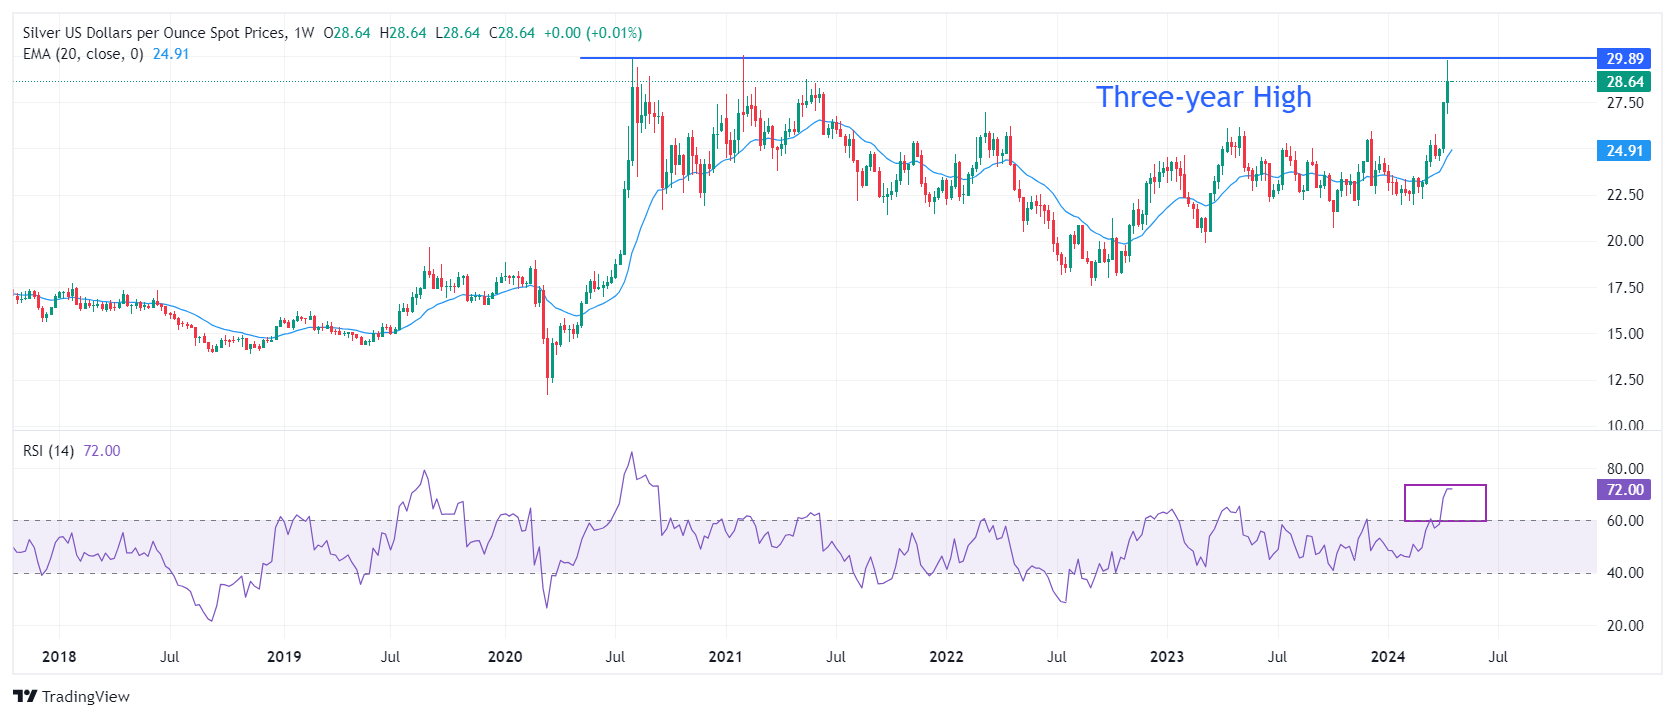
Silver price faces selling pressure while attempting to break above horizontal resistance plotted from 3 August 2020 high at $29.86. The long-term outlook of the white metal is bullish as the 20-week Exponential Moving Average (EMA) at $24.85 is sloping higher.

The 14-period Relative Strength Index (RSI) shifts into the bullish range of 60.00-80.00, suggesting a strong upside momentum.

Silver weekly chart

XAG/USD

Overview
Today last price 28.74
Today Daily Change 0.64
Today Daily Change % 2.28
Today daily open 28.1
 
Trends
Daily SMA20 26.44
Daily SMA50 24.58
Daily SMA100 24.03
Daily SMA200 23.65
 
Levels
Previous Daily High 29.02
Previous Daily Low 27.95
Previous Weekly High 29.8
Previous Weekly Low 26.88
Previous Monthly High 25.77
Previous Monthly Low 22.51
Daily Fibonacci 38.2% 28.36
Daily Fibonacci 61.8% 28.61
Daily Pivot Point S1 27.7
Daily Pivot Point S2 27.3
Daily Pivot Point S3 26.64
Daily Pivot Point R1 28.76
Daily Pivot Point R2 29.42
Daily Pivot Point R3 29.82


Disclaimer: For information purposes only. Past performance is not indicative of future results.
placeholder
New Fed Chair to Cut Forward Guidance? Warsh Rejects Dot-Plot Expectations, Bullish or Bearish for Bitcoin? If Warsh rejects dot plot projections, it could suppress institutional capital and weaken market risk appetite in the short term, but is a long-term positive for Bitcoin.On June 17, Asian
Author  TradingKey
7 hours ago
If Warsh rejects dot plot projections, it could suppress institutional capital and weaken market risk appetite in the short term, but is a long-term positive for Bitcoin.On June 17, Asian
placeholder
Three Major International Investment Banks Bearish on Oil Outlook, Citi Expects Brent to Fall to $70. Crude Oil Prices Fall for Four Straight Days to Levels at Start of US-Iraq War.On June 16, after US President Donald Trump sent consecutive signals of geopolitical easing, the two major crude oil benchmarks extended their recent declines and are poised to return to
Author  TradingKey
15 hours ago
On June 16, after US President Donald Trump sent consecutive signals of geopolitical easing, the two major crude oil benchmarks extended their recent declines and are poised to return to
placeholder
Japanese Yen hangs near intervention zone despite BoJ rate hike, ahead of FOMCThe USD/JPY pair ticks lower during the Asian session on Wednesday, though it remains within striking distance of the highest level since late April, touched last week.
Author  FXStreet
16 hours ago
The USD/JPY pair ticks lower during the Asian session on Wednesday, though it remains within striking distance of the highest level since late April, touched last week.
placeholder
Has Gold Hit Bottom? Barclays, Citi Both Bullish on Gold, Gold Price Will Return to $5,000 Next Year.Since 2026, gold has erased almost all of its gains and has fallen more than 20% from its record high of $5,595 set at the end of January. Has gold bottomed out? Is now the time to add to
Author  TradingKey
Yesterday 10: 30
Since 2026, gold has erased almost all of its gains and has fallen more than 20% from its record high of $5,595 set at the end of January. Has gold bottomed out? Is now the time to add to
placeholder
WTI hovers around $80.00 as traders await developments on US-Iran peace talksWest Texas Intermediate (WTI) oil price inches higher after registering 3.7% losses in the previous day, trading around $80.10 per barrel during the Asian hours on Tuesday.
Author  FXStreet
Yesterday 01: 19
West Texas Intermediate (WTI) oil price inches higher after registering 3.7% losses in the previous day, trading around $80.10 per barrel during the Asian hours on Tuesday.
Related Instrument
goTop
quote