Silver Price Analysis: XAG/USD climbs closer to mid-$28.00s, remains below YTD top set on Friday

Source Fxstreet
  • Silver regains positive traction and reverses a part of Friday’s retracement slide from the YTD peak.
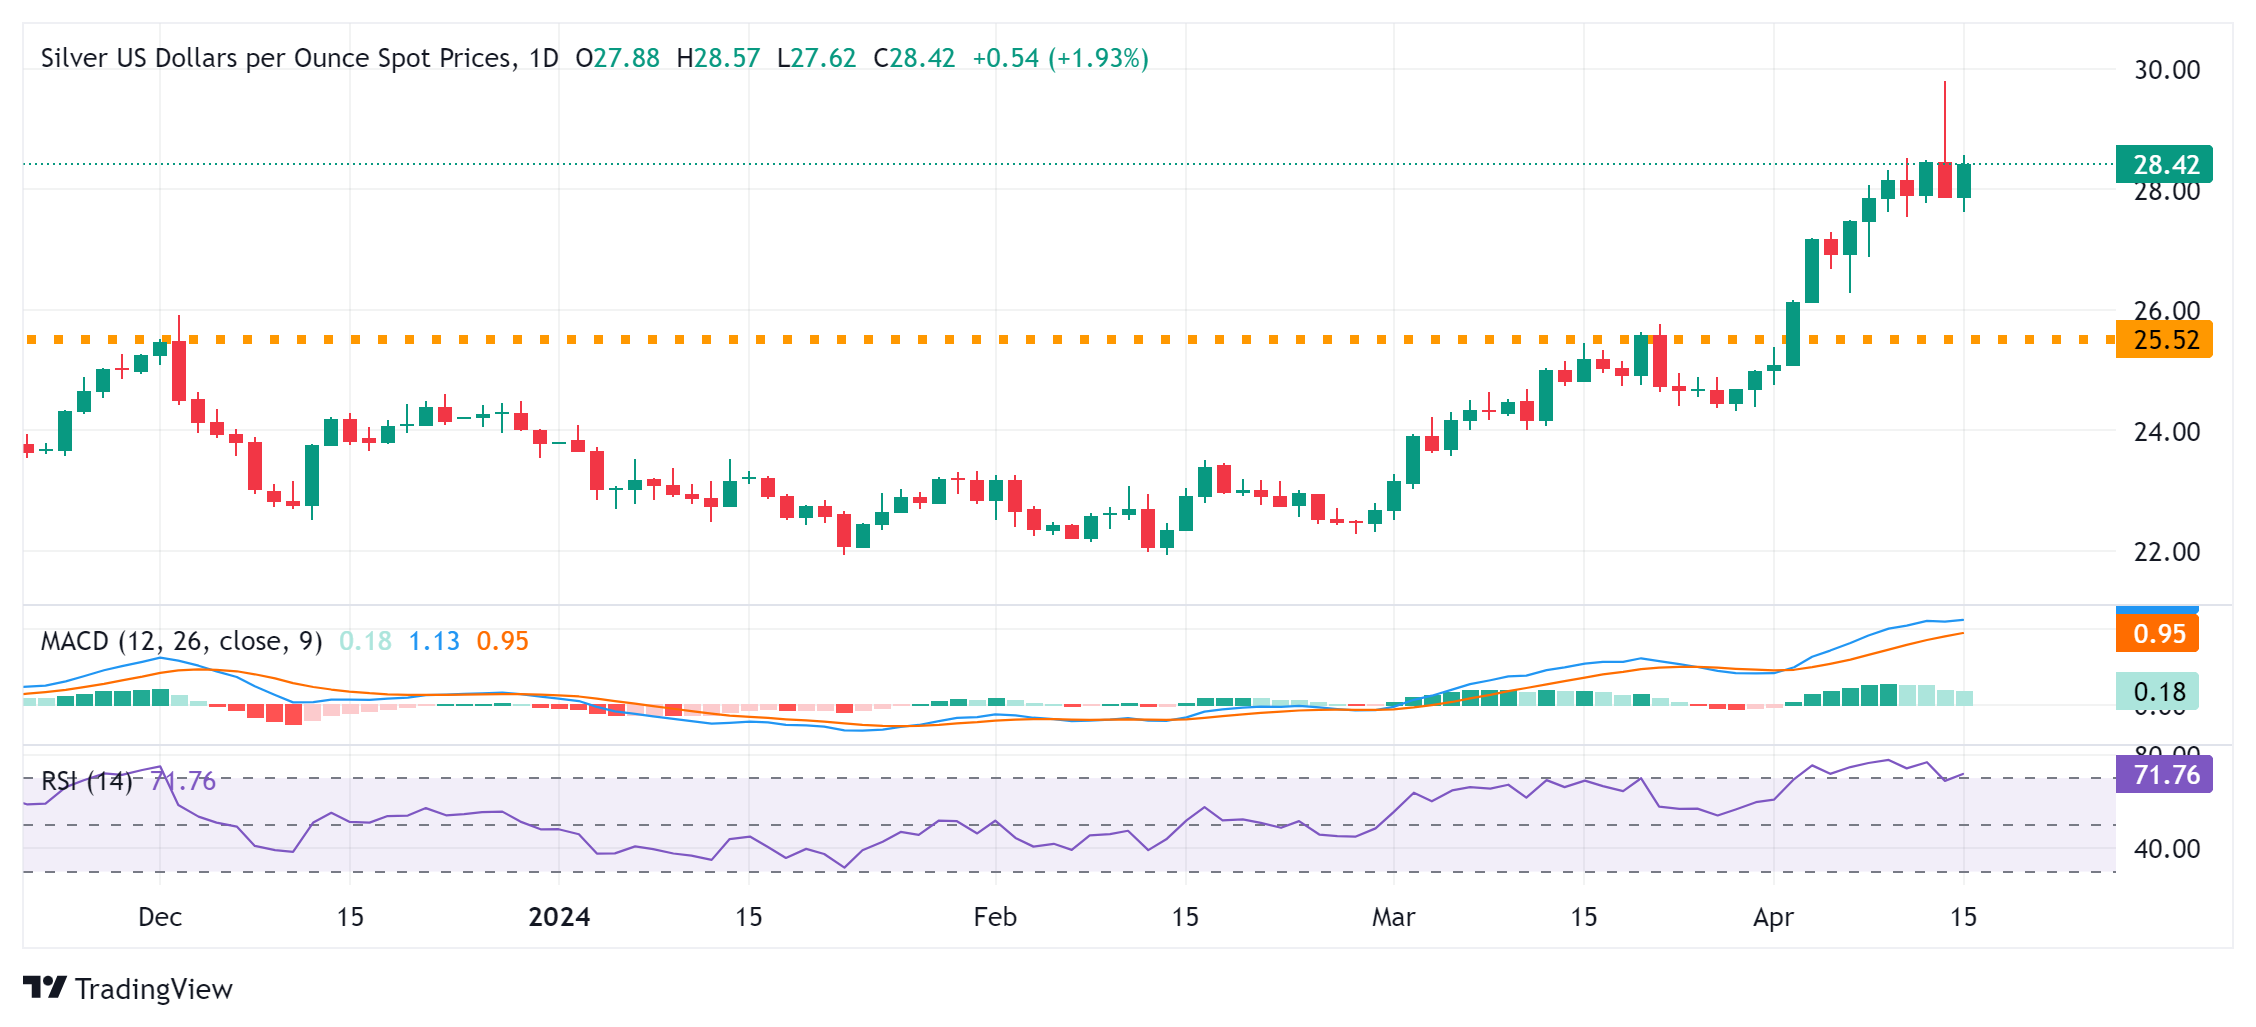
  • The RSI on the daily chart is flashing overbought conditions and warrants caution for bullish traders.
  • Any meaningful slide might continue to attract fresh buyers and is more likely to remain cushioned.

Silver (XAG/USD) catches fresh bids on the first day of a new week and stalls its retracement slide from the vicinity of the $29.80 region, or the highest level since February 2021 touched on Friday. The white metal sticks to intraday gains through the early part of the European session and is currently placed just below mid-$28.00s.

From a technical perspective, the recent breakout through the $25.60-$25.70 horizontal resistance and the subsequent move up was seen as a fresh trigger for bullish traders. That said, the Relative Strength Index (RSI) is flashing overbought conditions on the daily chart and makes it prudent to wait for some near-term consolidation or a modest pullback before positioning for any further appreciating move.

Meanwhile, any corrective decline below the $28.00 round figure is likely to find decent support near the $27.80-$27.75 region, below which the XAG/USD could accelerate the fall towards the $27.25 area en route to the $27.00 mark. Some follow-through selling might expose the next relevant support near the $26.35-$26.30 region before the white metal drops to the $26.00 mark and the $25.70-$25.60 resistance breakpoint.

On the flip side, sustained strength back above the $28.50 level should allow the XAG/USD to reclaim the $29.00 mark. The momentum could extend further towards the $29.80 zone, or the YTD peak, above which bulls are likely to aim back towards conquering the $30.00 psychological mark.

Silver daily chart

fxsoriginal

XAG/USD

Overview
Today last price 28.39
Today Daily Change 0.51
Today Daily Change % 1.83
Today daily open 27.88
 
Trends
Daily SMA20 26.1
Daily SMA50 24.34
Daily SMA100 23.95
Daily SMA200 23.6
 
Levels
Previous Daily High 29.8
Previous Daily Low 27.88
Previous Weekly High 29.8
Previous Weekly Low 26.88
Previous Monthly High 25.77
Previous Monthly Low 22.51
Daily Fibonacci 38.2% 28.61
Daily Fibonacci 61.8% 29.07
Daily Pivot Point S1 27.24
Daily Pivot Point S2 26.6
Daily Pivot Point S3 25.32
Daily Pivot Point R1 29.16
Daily Pivot Point R2 30.44
Daily Pivot Point R3 31.08


Disclaimer: For information purposes only. Past performance is not indicative of future results.
placeholder
Gold Suffers Epic Plunge, March Cumulative Decline Exceeds 20%. Has Gold Become a Risk Asset?At 3:21 AM Beijing time during the Asian trading session, Spot gold (XAUUSD) fell nearly 9% intraday, at one point dropping below the $4,100 per ounce mark. This not only erased all gains
Author  TradingKey
12 hours ago
At 3:21 AM Beijing time during the Asian trading session, Spot gold (XAUUSD) fell nearly 9% intraday, at one point dropping below the $4,100 per ounce mark. This not only erased all gains
placeholder
Iran threatens to completely close Strait of Hormuz if US bombs power plantsIran’s Islamic Revolutionary Guard Corps (IRGC) said that it will completely shut the strait if US President Donald Trump proceeds with his threats to target Iranian energy facilities, the Guardian reported on Monday.
Author  FXStreet
21 hours ago
Iran’s Islamic Revolutionary Guard Corps (IRGC) said that it will completely shut the strait if US President Donald Trump proceeds with his threats to target Iranian energy facilities, the Guardian reported on Monday.
placeholder
$180 Oil Prices Imminent? Saudi Arabia Warns: Crisis to Last Until Late April, Oil Prices Will Break Historic HighsThe continuous escalation of geopolitical conflicts in the Middle East is pushing global energy markets toward their most severe test in nearly 20 years.The Wall Street Journal reports th
Author  TradingKey
Mar 20, Fri
The continuous escalation of geopolitical conflicts in the Middle East is pushing global energy markets toward their most severe test in nearly 20 years.The Wall Street Journal reports th
placeholder
Gold tumbles below $4,650 as inflation fears and liquidity squeeze weighGold price (XAU/USD) remains under selling pressure near $4,640 during the early Asian session on Friday. The precious metal extends the decline as soaring crude oil and energy prices, driven by the escalating US-Israeli war with Iran, reignite inflation fears.
Author  FXStreet
Mar 20, Fri
Gold price (XAU/USD) remains under selling pressure near $4,640 during the early Asian session on Friday. The precious metal extends the decline as soaring crude oil and energy prices, driven by the escalating US-Israeli war with Iran, reignite inflation fears.
placeholder
Bitcoin Drops Below $70,000 as Crypto Rally Fails to MaterializeThe crypto market experienced a significant pullback, Bitcoin (BTCUSD) fell below the key $70,000 mark during intraday trading, triggering short-term stop-loss orders and causing market s
Author  TradingKey
Mar 19, Thu
The crypto market experienced a significant pullback, Bitcoin (BTCUSD) fell below the key $70,000 mark during intraday trading, triggering short-term stop-loss orders and causing market s
Related Instrument
goTop
quote