Silver Price Forecast: XAG/USD slumps from two-year high near $28.30 on hot US Inflation data

Source Fxstreet
  • Silver price plummets to $27.85 as speculation for Fed pivoting to rate cuts erode.
  • Hot US inflation data dent Fed rate cut prospects for June.
  • Uncertainty over Fed’s three rate cut projections by the year-end deepens.

Siver price (XAG/USD) retreats from fresh two-year high of $28.36 after the United States Bureau of Labor Statistics (BLS) reported that the consumer price inflation turns out sticky. Hot inflation figures combined with strong payroll data for March have dented market expectations for the Federal Reserve (Fed) to begin lowering interest rates from the June meeting.

The annual headline Consumer Price Index (CPI) accelerated to 3.5% from expectations of 3.4% and the prior reading of 3.2%. Annual core inflation that excludes volatile food and energy prices rose steadily by 3.8%. Economists expected the most sought-after inflation measure to decelerate to 3.7%.

Fed policymakers have been reiterating that it is not appropriate to reduce interest rates until they get convinced that inflation will return sustainably to the 2% target. For inflation to return to 2%, the monthly inflation should increase at a pace of 0.17%. In March, both headline and core CPI rose steadily by 0.4% against expectations of 0.3%.

Going forward, traders are expected to shift their bets for the Fed beginning to reduce interest rates in the third quarter this year. Stubbornly higher inflation is expected to deepen uncertainty over three rate cut projections for this year as anticipated by Fed policymakers in the latest dot plot.

Hot CPI figures have led to a sharp increase in yields on interest-bearing assets, such as US bonds. 10-year US Treasury yields have risen to 4.48%. The US Dollar Index (DXY) rallies to the crucial resistance of 105.00.

Silver technical analysis

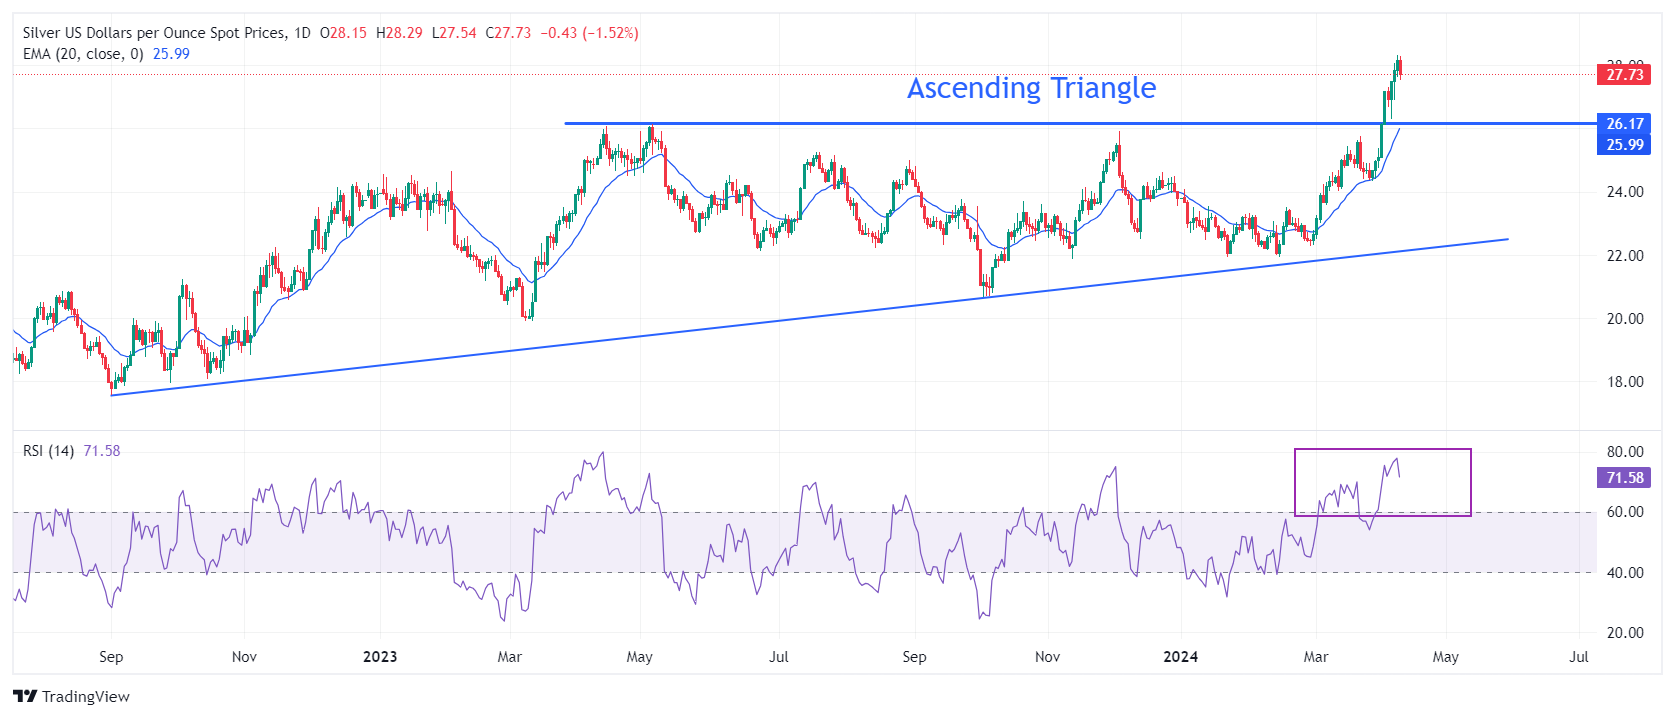
Silver price delivers a stalwart rally after a breakout of the Ascending Triangle chart pattern formed on a daily timeframe. The strength of the breakout will be tested if the white metal corrects to the horizontal resistance of the above-mentioned chart pattern plotted from 14 April 2023 high at $26.09. Upward-sloping 20-day Exponential Moving Average (EMA) at $26.00 suggests that the near-term demand remains upbeat.

The 14-period Relative Strength Index (RSI) drops after reaching 76.00, indicating that oscillators are cooling after turning extremely overbought.

Silver daily chart
XAG/USD

Overview
Today last price 27.84
Today Daily Change -0.31
Today Daily Change % -1.10
Today daily open 28.15
 
Trends
Daily SMA20 25.59
Daily SMA50 24.04
Daily SMA100 23.82
Daily SMA200 23.52
 
Levels
Previous Daily High 28.33
Previous Daily Low 27.62
Previous Weekly High 27.5
Previous Weekly Low 24.75
Previous Monthly High 25.77
Previous Monthly Low 22.51
Daily Fibonacci 38.2% 28.06
Daily Fibonacci 61.8% 27.89
Daily Pivot Point S1 27.74
Daily Pivot Point S2 27.33
Daily Pivot Point S3 27.03
Daily Pivot Point R1 28.45
Daily Pivot Point R2 28.74
Daily Pivot Point R3 29.15


Disclaimer: For information purposes only. Past performance is not indicative of future results.
placeholder
Top 3 Price Prediction: Bitcoin, Ethereum, Ripple – BTC, ETH and XRP Look for a Foothold After a Sharp ShakeoutBitcoin trades near $92,600 after a dip below $90,000, while Ethereum around $3,118 and XRP near $2.21–$2.23 sit on key support zones, as BTC, ETH and XRP all try to turn a sharp correction into a tradable rebound rather than a deeper slide.
Author  Mitrade
Nov 19, Wed
Bitcoin trades near $92,600 after a dip below $90,000, while Ethereum around $3,118 and XRP near $2.21–$2.23 sit on key support zones, as BTC, ETH and XRP all try to turn a sharp correction into a tradable rebound rather than a deeper slide.
placeholder
Even As Bitcoin's Price Falls, Michael Saylor Feels 'Indestructible'The price of Bitcoin dipped below $89,000, setting a new weekly low as corporate buyer Strategy remains bullish.
Author  Mitrade
Yesterday 03: 08
The price of Bitcoin dipped below $89,000, setting a new weekly low as corporate buyer Strategy remains bullish.
placeholder
Could XRP Really Catch Ethereum? Analysts Revisit the Question as ETF Tailwinds BuildAs US spot XRP ETFs roll out and issuers like Canary Capital and Franklin Templeton step in, analysts say XRP’s market cap could climb on growing utility and ETF accumulation—but overtaking Ethereum’s $373 billion smart-contract powerhouse remains a long-shot, at least for now.
Author  Mitrade
Yesterday 03: 28
As US spot XRP ETFs roll out and issuers like Canary Capital and Franklin Templeton step in, analysts say XRP’s market cap could climb on growing utility and ETF accumulation—but overtaking Ethereum’s $373 billion smart-contract powerhouse remains a long-shot, at least for now.
placeholder
Bitcoin's Drop to $86K Approaches 'Max Pain' Zone, Yet Presents Potential Buying OpportunityAnalysts identify the $84,000 to $73,000 range as Bitcoin's likely "max pain" territory where capitulation may occur.
Author  Mitrade
11 hours ago
Analysts identify the $84,000 to $73,000 range as Bitcoin's likely "max pain" territory where capitulation may occur.
placeholder
Market Meltdown: BTC, ETH, and XRP Capitulate as Bears Seize ControlBitcoin trades around $85,900 after breaking below $86,000, with Ethereum under $2,791 and XRP below $1.99 as BTC, ETH and XRP extend weekly losses of 8–10%, forcing traders to focus on supports at $85,000, $2,749 and $1.77 for clues on whether this sell-off has further to run.
Author  Mitrade
10 hours ago
Bitcoin trades around $85,900 after breaking below $86,000, with Ethereum under $2,791 and XRP below $1.99 as BTC, ETH and XRP extend weekly losses of 8–10%, forcing traders to focus on supports at $85,000, $2,749 and $1.77 for clues on whether this sell-off has further to run.
goTop
quote