


Gold price pauses rally amid heightened investor caution ahead of US Nonfarm Payrolls
- Gold price turns sideways near all-time highs as focus shifts to the US NFP report.
- The US Dollar rises as Fed Kashkari said he sees no rate cuts if inflation remains stubborn.
- Escalating Middle East tensions keep safe-haven bids strong.
Gold price’s (XAU/USD) rally pauses after refreshing all-time highs near $2,305 amid uncertainty ahead of the release of the United States Nonfarm Payrolls (NFP) data for March. The labor market data is expected to influence market expectations for the Federal Reserve (Fed) rate cuts, which financial markets are currently anticipating for June.
The CME FedWatch Tool shows that traders are pricing in a 61% chance that the Fed will trim interest rates in June, an inch higher from 60% a week ago. Traders bets for Fed rate cuts remain broadly unchanged as surprisingly weak US Services PMI for March offset the negative impact of hawkish commentary from a slew of Fed policymakers. Meanwhile, 10-year US Treasury yields are up at 4.34%.
Surprisingly, the Services PMI fell to 51.4 in March, from expectations of 52.7, and the former reading was 52.6.
Meanwhile, the near-term appeal of Gold remains strong due to escalating Middle East tensions. Air strikes from Israeli forces on the Iranian embassy in Damascus, situated near Syria’s capital, have deepened fears of Iran’s participation in the Israel-Palestine war. Rising geopolitical tensions lead investors towards safe-haven assets such as Gold.
Daily digest market movers: Gold price awaits US NFP for fresh guidance
- Gold price takes a breather as investors turn cautious ahead of the United States NFP report for March, which will be published at 12:30 GMT. It is anticipated that the United States employers recruited 200K jobs, lower than the robust hiring of 275K seen in February. The Unemployment Rate is anticipated to remain unchanged at 3.9%.
- Investors will also focus on March's Average Hourly Earnings data to gain more insights about the inflation outlook. Economists expect monthly wage growth to have grown at a higher pace of 0.3% from 0.1% in February. Annual wage growth is forecasted to have grown by 4.1%, decelerating from the prior reading of 4.3%.
- Higher wage growth could slow the progress in inflation declining towards 2%, which could negatively influence market expectations for the Federal Reserve (Fed) to begin reducing interest rates in June. If this happens, the opportunity cost of holding an investment in non-yielding assets such as Gold will increase, weighing on its price. On the contrary, slowing wage growth will strengthen Gold’s appeal.
- Meanwhile, the stabilization in the US Dollar’s valuation after the Fed’s hawkish guidance on interest rates has also put slight pressure on the Gold price. The US Dollar Index (DXY) finds support from a two-week low of 103.90 after Minneapolis Fed Bank President Neel Kashkari said rate cuts won’t be required this year if inflation stalls.
- Kashkari said he forecasted two rate cuts by 2024 in the latest Fed dot plot. “The Fed needs to keep interest rates higher in the range of 5.25%-5.50% if inflation remains stronger than hoped,” Kashkari warned. He added that if that still did not work, further rate increases are not off the table, but they are also not a likely scenario given what we know right now," Reuters reports.
Technical Analysis: Gold price trades near all-time highs around $2,300
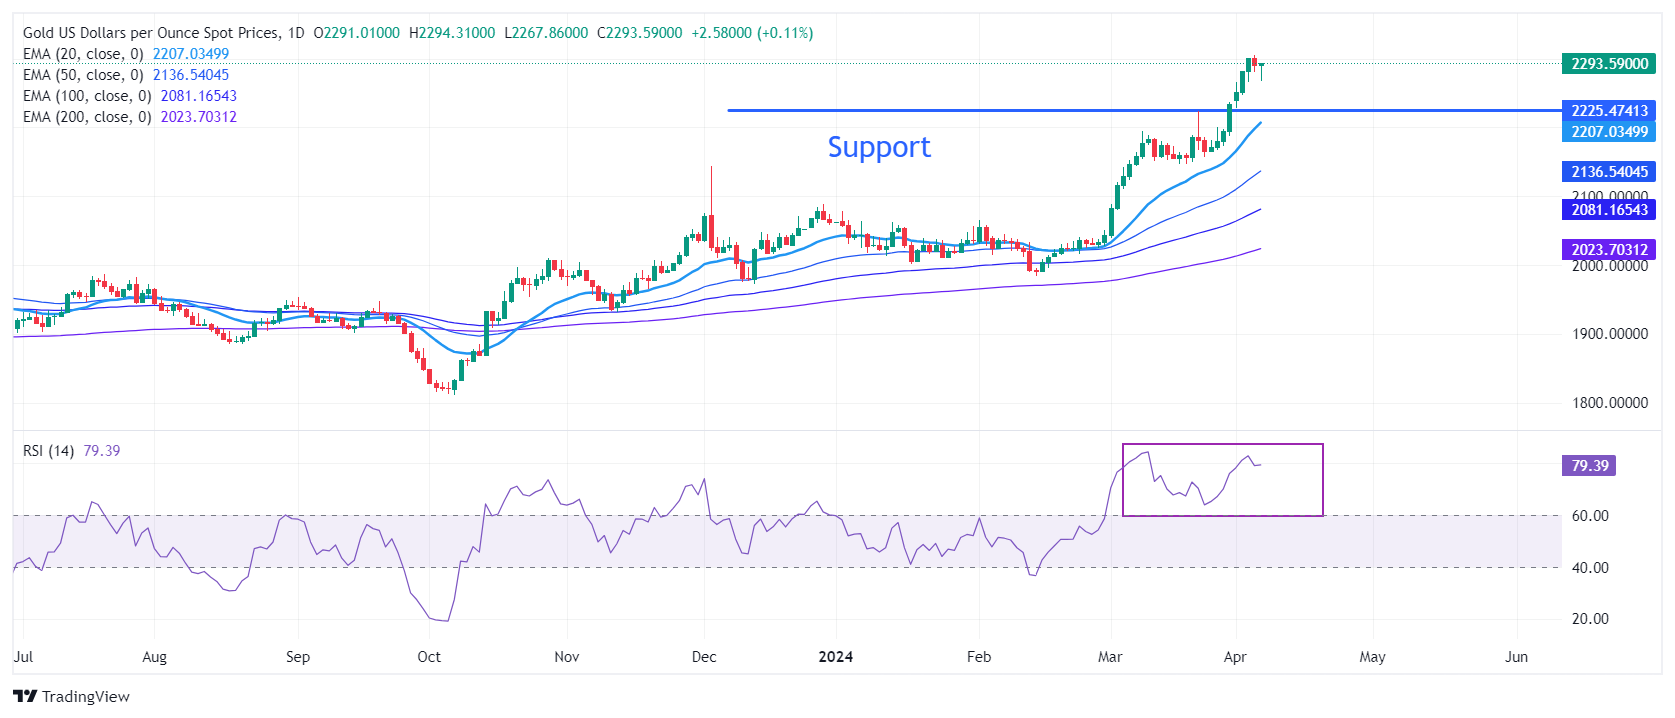
Gold price falls slightly after achieving the $2,300 milestone. The near-term demand remains unabated as all short-to-long term Exponential Moving Averages (EMAs) are sloping higher. On the downside, March 21 high at $2,223 will be a major support area for the Gold price bulls.
The 14-period Relative Strength Index (RSI) near 80.00 indicates that a bullish momentum is still active. However, overbought signals have emerged.
Gold FAQs
Gold has played a key role in human’s history as it has been widely used as a store of value and medium of exchange. Currently, apart from its shine and usage for jewelry, the precious metal is widely seen as a safe-haven asset, meaning that it is considered a good investment during turbulent times. Gold is also widely seen as a hedge against inflation and against depreciating currencies as it doesn’t rely on any specific issuer or government.
Central banks are the biggest Gold holders. In their aim to support their currencies in turbulent times, central banks tend to diversify their reserves and buy Gold to improve the perceived strength of the economy and the currency. High Gold reserves can be a source of trust for a country’s solvency. Central banks added 1,136 tonnes of Gold worth around $70 billion to their reserves in 2022, according to data from the World Gold Council. This is the highest yearly purchase since records began. Central banks from emerging economies such as China, India and Turkey are quickly increasing their Gold reserves.
Gold has an inverse correlation with the US Dollar and US Treasuries, which are both major reserve and safe-haven assets. When the Dollar depreciates, Gold tends to rise, enabling investors and central banks to diversify their assets in turbulent times. Gold is also inversely correlated with risk assets. A rally in the stock market tends to weaken Gold price, while sell-offs in riskier markets tend to favor the precious metal.
The price can move due to a wide range of factors. Geopolitical instability or fears of a deep recession can quickly make Gold price escalate due to its safe-haven status. As a yield-less asset, Gold tends to rise with lower interest rates, while higher cost of money usually weighs down on the yellow metal. Still, most moves depend on how the US Dollar (USD) behaves as the asset is priced in dollars (XAU/USD). A strong Dollar tends to keep the price of Gold controlled, whereas a weaker Dollar is likely to push Gold prices up.
Recommended Articles


