Silver Price Analysis: Continues lower after Bearish Engulfing

Source Fxstreet
  • Silver price continues falling after touching the top of its range and forming a Bearish Engulfing candlestick pattern. 
  • The MACD has crossed its signal line giving a sell signal. 
  • Silver price will probably fall towards a cluster of MAs in the $23.000s
     

Silver price (XAG/USD) is trading in the $24.580s on Friday. It has just reversed after touching the top of a multi-month range. 

Silver rallied up during the first half of March until it reached the ceiling of a long-term range at around $25.750. At that point it reversed and formed a Bearish Engulfing Japanese candlestick pattern on the following day, Mar 21 (circled). 

A Bearish Engulfing is an indicator of a short-term reversal in price. It forms when a red candlestick’s whole daily range completely encloses, or “engulfs”, the previous day’s range. The appearance of the pattern adds a further bearish hue to the picture. 

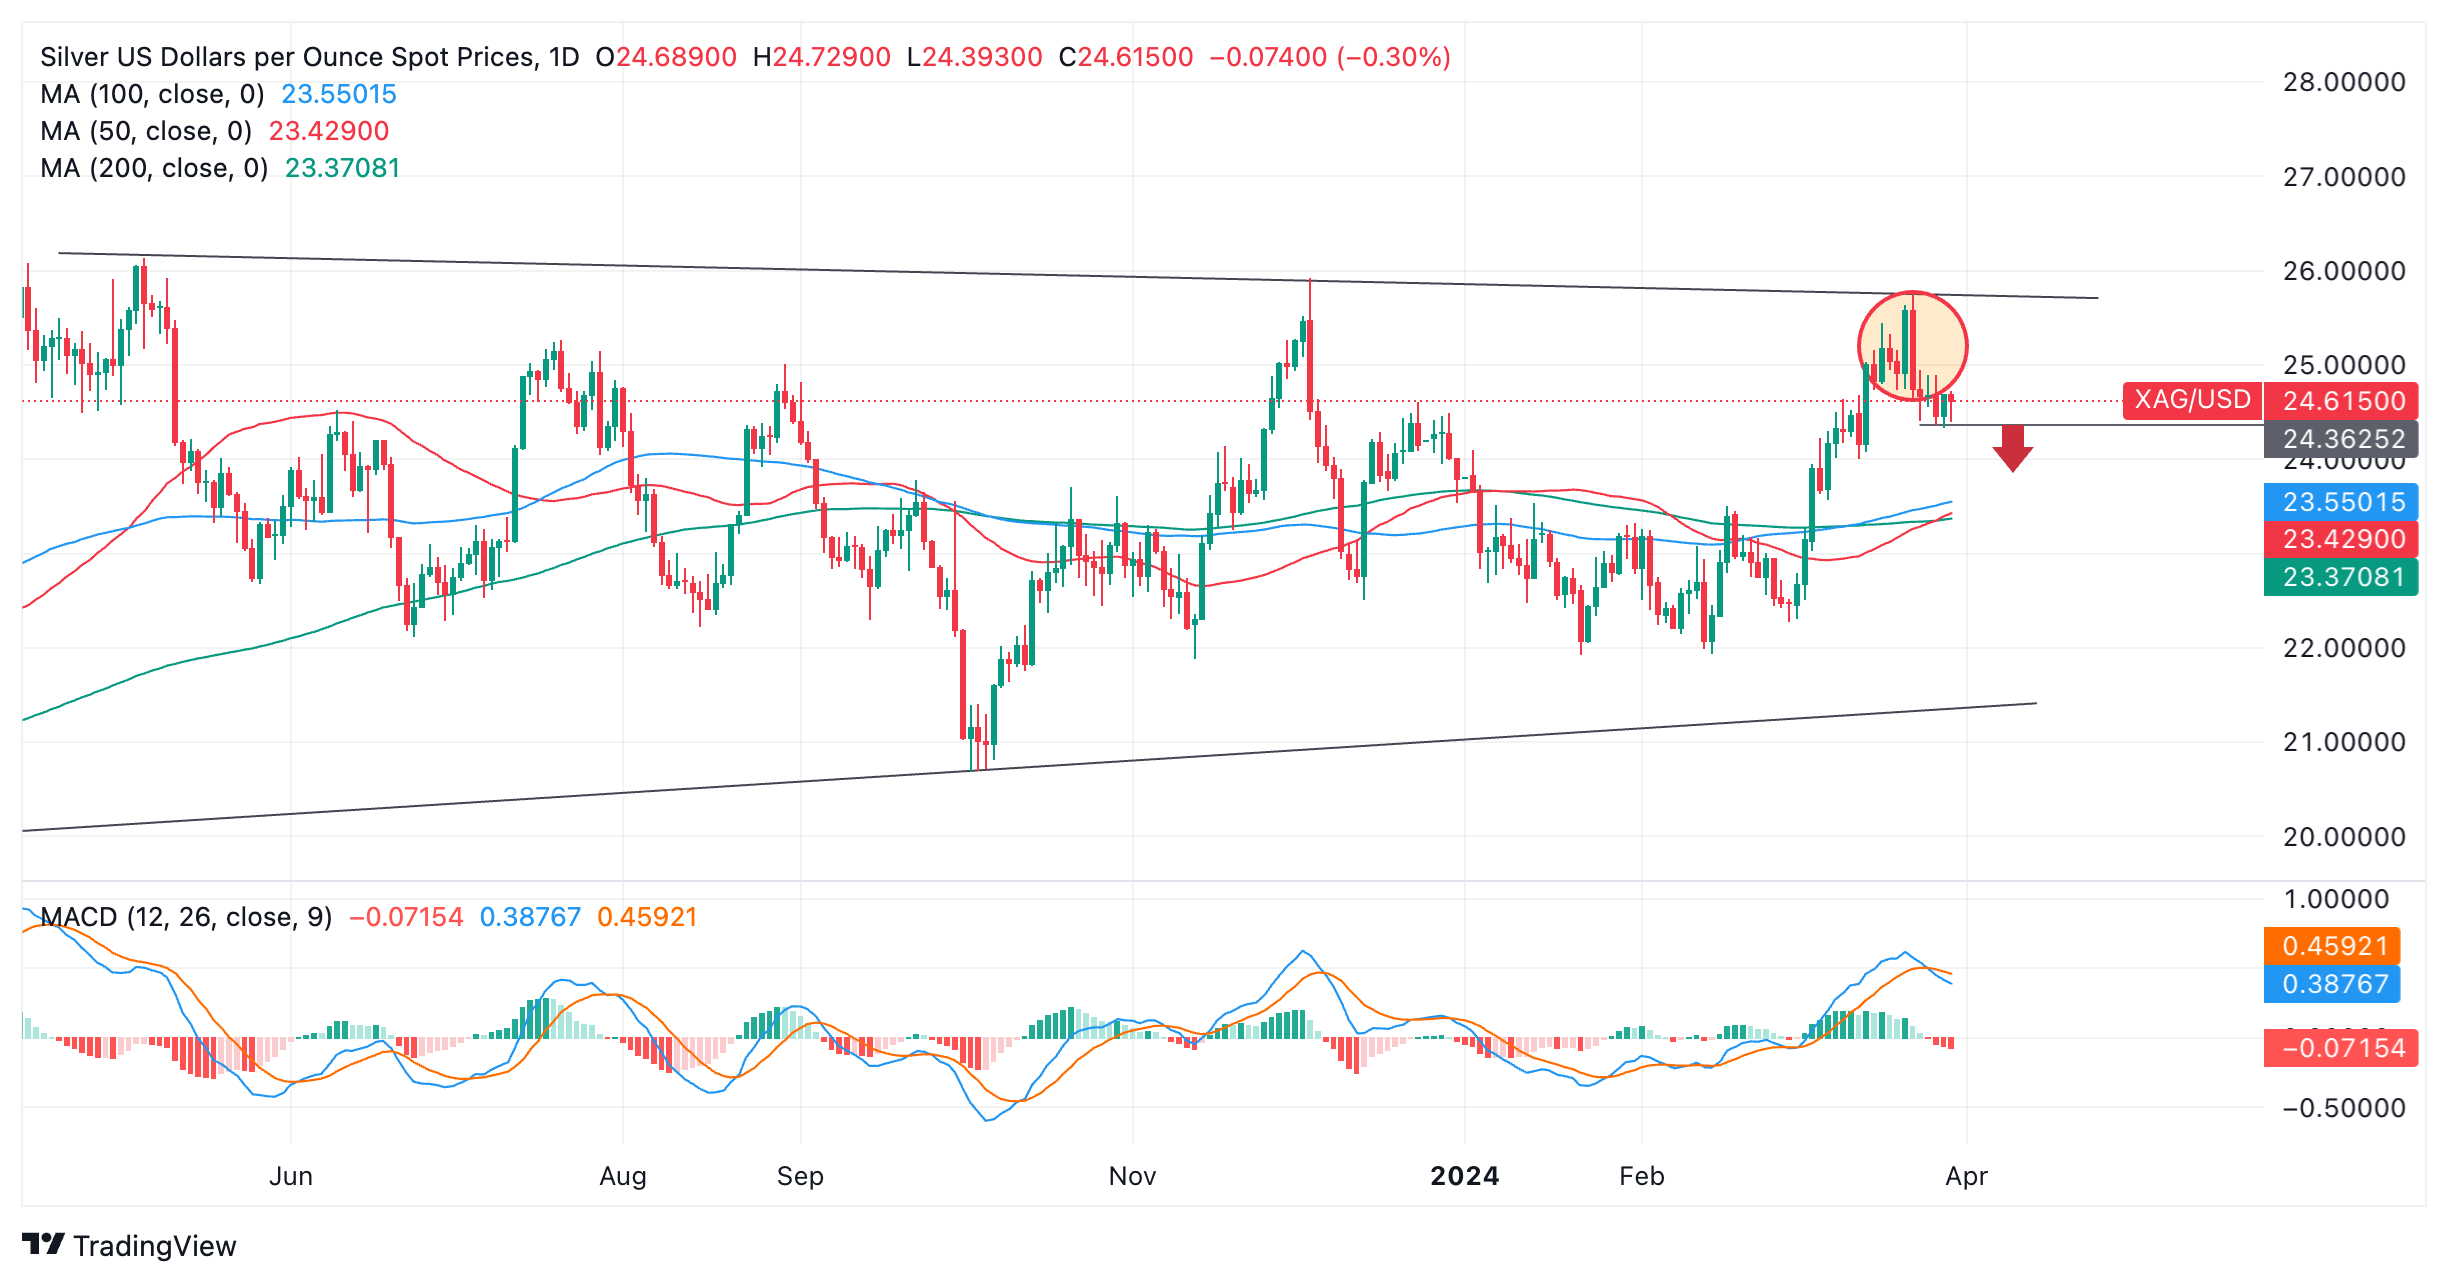
Silver versus US Dollar: Daily chart 

The Moving Average Convergence/ Divergence (MACD) momentum indicator has crossed below its signal line, giving a sell signal. The MACD is an especially reliable indicator within range-bound markets and adds credence to the bearish view. 

The pair will probably continue south to a potential target at the cluster of major moving averages, in the lower $23.000s. The topmost is the 100-day Simple Moving Average (SMA) at $23.550. 

A break below the $24.320 levels of March 27 would provide more bearish confidence of a move lower.  

Alternatively if bulls take back control, a break back above the $25.770 highs of Thursday would probably indicate an extension of the uptrend. 

A decisive break above the range highs would indicate more upside. Such a move would be expected to then reach a conservative target at the 0.618 Fibonacci extrapolation of the height of the range from the breakout point higher, and a target at $28.524.

A decisive break is one in which a level is breached by a long green candlestick which closes near its high, or three green candlesticks that break above the level.


Disclaimer: For information purposes only. Past performance is not indicative of future results.
placeholder
Ethereum (ETH) Price Closes Above $3,900 — Is a New All-Time High Possible Before 2024 Ends?Once again, the price of Ethereum (ETH) has risen above $3,900. This bounce has hinted at a further price increase for the altcoin before the end of the year.
Author  Beincrypto
Dec 17, 2024
Once again, the price of Ethereum (ETH) has risen above $3,900. This bounce has hinted at a further price increase for the altcoin before the end of the year.
placeholder
Markets in 2026: Will gold, Bitcoin, and the U.S. dollar make history again? — These are how leading institutions thinkAfter a turbulent 2025, what lies ahead for commodities, forex, and cryptocurrency markets in 2026?
Author  Insights
Dec 25, 2025
After a turbulent 2025, what lies ahead for commodities, forex, and cryptocurrency markets in 2026?
placeholder
WTI climbs to $76.00, eyes one-year high amid rising tensions in the Middle EastWest Texas Intermediate (WTI) US Crude Oil prices attract fresh buyers on Wednesday and climb back closer to the highest level since January 2025, touched the previous day.
Author  FXStreet
Mar 04, Wed
West Texas Intermediate (WTI) US Crude Oil prices attract fresh buyers on Wednesday and climb back closer to the highest level since January 2025, touched the previous day.
placeholder
Gold rises as safe-haven demand increases on Iran warGold price (XAU/USD) extends its gains for the second successive session on Thursday as traders seek safety amid the ongoing war in the Middle East.
Author  FXStreet
Mar 05, Thu
Gold price (XAU/USD) extends its gains for the second successive session on Thursday as traders seek safety amid the ongoing war in the Middle East.
placeholder
US Dollar Index gathers strength to near 99.00 on Middle East tensions, robust US services data The US Dollar Index (DXY), an index of the value of the US Dollar (USD) measured against a basket of six world currencies, currently trades near 99.00 during the early European trading hours on Thursday. The DXY edges higher amid uncertainty and persistent geopolitical risks in the Middle East.
Author  FXStreet
Mar 05, Thu
The US Dollar Index (DXY), an index of the value of the US Dollar (USD) measured against a basket of six world currencies, currently trades near 99.00 during the early European trading hours on Thursday. The DXY edges higher amid uncertainty and persistent geopolitical risks in the Middle East.
Related Instrument
goTop
quote