Silver Price Forecast: XAG/USD rises to $24.70 ahead of US core PCE Inflation

Source Fxstreet
  • Silver price moves higher to $24.70, while the broader trend is sideways.
  • The core PCE inflation will provide cues about Fed’s rate cut timing.
  • Fed policymakers see three rate cuts by the year-end.

Silver price (XAG/USD) advances to $24.70 in the late Asian session on Thursday. The white metal posts gains ahead of the United States core Personal Consumption Expenditure Price Index (PCE) data for February, which will be published on Friday.

Core PCE will provide cues about when the Federal Reserve (Fed) will begin reducing interest rates. The annual underlying inflation data is estimated to have grown steadily by 2.8%, with monthly growth declining to 0.3% from 0.4% in January.

Currently, market expectations indicate that the Fed will cut interest rates from the June policy meeting. The expectations also show that there will be three rate cuts by the year-end, as projected by Fed policymakers in the monetary policy meeting last week.

According to the CME FedWatch tool, traders are pricing in 64% chance that the Fed will trim interest rates in June.

Meanwhile, the US Dollar Index (DXY) edges down slightly from monthly highs of 104.50. The USD Index is broadly sideways in a 104.00-104.50 range from last four trading sessions. The US core PCE inflation is expected to support the USD index to blown out the consolidation. 10-year US Treasury yields rebound to 4.21% after falling sharply to 4.18% on Wednesday.

Silver technical analysis

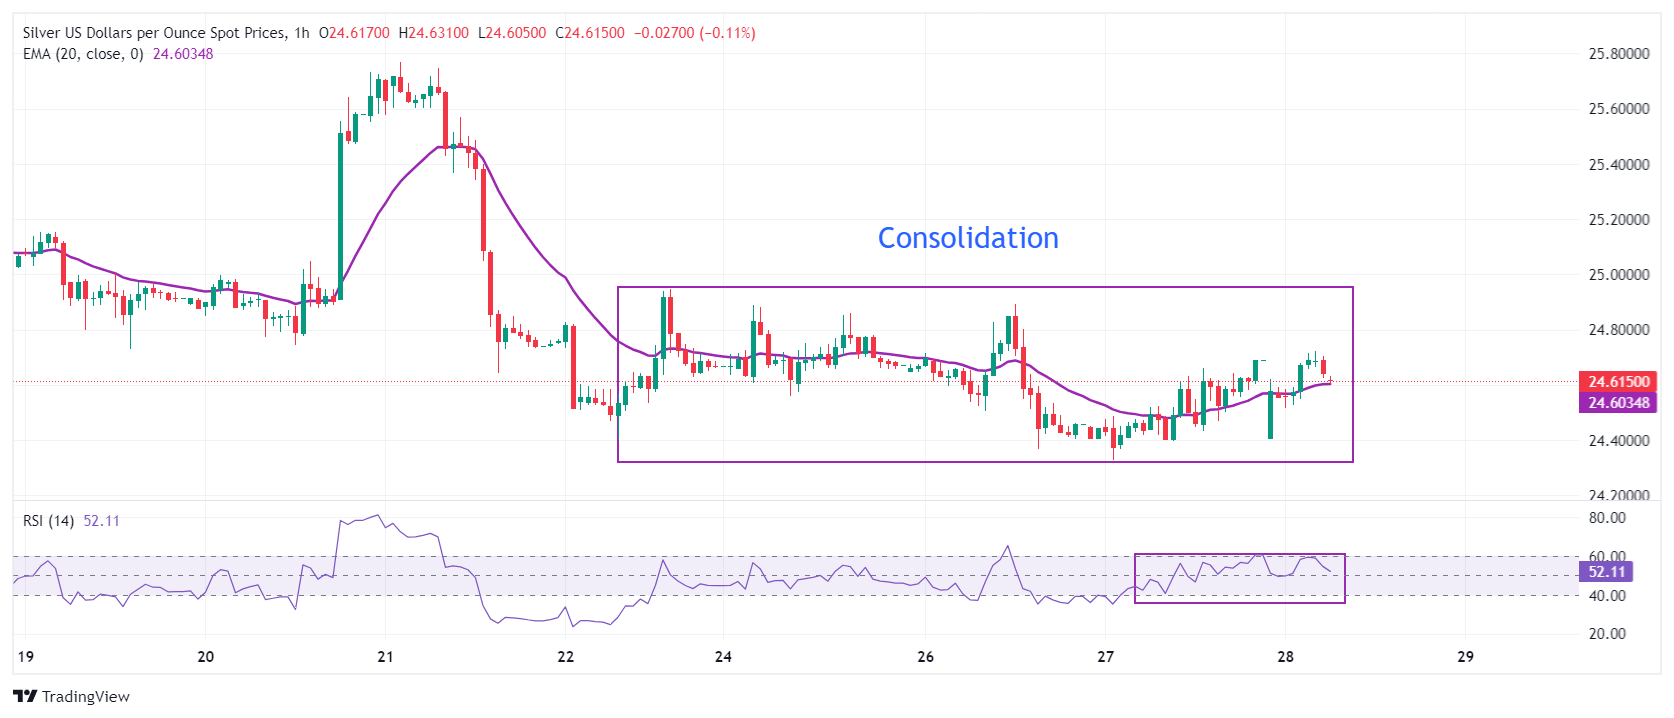
Silver price consolidates in a range of $24.32-$25.00 from a week. This exhibits an indecisiveness among market participants. The 20-period Exponential Moving Average (EMA) at $24.60 remain stick to the spot price, demonstrating a sideways trend.

The 14-period Relative Strength Index (RSI) oscillates in the 40.00-60.00 zone, indicating a sharp volatility contraction.

Silver hourly chart

XAG/USD

Overview
Today last price 24.64
Today Daily Change -0.05
Today Daily Change % -0.20
Today daily open 24.69
 
Trends
Daily SMA20 24.43
Daily SMA50 23.39
Daily SMA100 23.53
Daily SMA200 23.36
 
Levels
Previous Daily High 24.69
Previous Daily Low 24.33
Previous Weekly High 25.77
Previous Weekly Low 24.4
Previous Monthly High 23.5
Previous Monthly Low 21.93
Daily Fibonacci 38.2% 24.55
Daily Fibonacci 61.8% 24.47
Daily Pivot Point S1 24.45
Daily Pivot Point S2 24.21
Daily Pivot Point S3 24.09
Daily Pivot Point R1 24.81
Daily Pivot Point R2 24.93
Daily Pivot Point R3 25.17


Disclaimer: For information purposes only. Past performance is not indicative of future results.
placeholder
New Fed Chair to Cut Forward Guidance? Warsh Rejects Dot-Plot Expectations, Bullish or Bearish for Bitcoin? If Warsh rejects dot plot projections, it could suppress institutional capital and weaken market risk appetite in the short term, but is a long-term positive for Bitcoin.On June 17, Asian
Author  TradingKey
12 hours ago
If Warsh rejects dot plot projections, it could suppress institutional capital and weaken market risk appetite in the short term, but is a long-term positive for Bitcoin.On June 17, Asian
placeholder
Three Major International Investment Banks Bearish on Oil Outlook, Citi Expects Brent to Fall to $70. Crude Oil Prices Fall for Four Straight Days to Levels at Start of US-Iraq War.On June 16, after US President Donald Trump sent consecutive signals of geopolitical easing, the two major crude oil benchmarks extended their recent declines and are poised to return to
Author  TradingKey
20 hours ago
On June 16, after US President Donald Trump sent consecutive signals of geopolitical easing, the two major crude oil benchmarks extended their recent declines and are poised to return to
placeholder
Japanese Yen hangs near intervention zone despite BoJ rate hike, ahead of FOMCThe USD/JPY pair ticks lower during the Asian session on Wednesday, though it remains within striking distance of the highest level since late April, touched last week.
Author  FXStreet
20 hours ago
The USD/JPY pair ticks lower during the Asian session on Wednesday, though it remains within striking distance of the highest level since late April, touched last week.
placeholder
Has Gold Hit Bottom? Barclays, Citi Both Bullish on Gold, Gold Price Will Return to $5,000 Next Year.Since 2026, gold has erased almost all of its gains and has fallen more than 20% from its record high of $5,595 set at the end of January. Has gold bottomed out? Is now the time to add to
Author  TradingKey
Yesterday 10: 30
Since 2026, gold has erased almost all of its gains and has fallen more than 20% from its record high of $5,595 set at the end of January. Has gold bottomed out? Is now the time to add to
placeholder
WTI hovers around $80.00 as traders await developments on US-Iran peace talksWest Texas Intermediate (WTI) oil price inches higher after registering 3.7% losses in the previous day, trading around $80.10 per barrel during the Asian hours on Tuesday.
Author  FXStreet
Yesterday 01: 19
West Texas Intermediate (WTI) oil price inches higher after registering 3.7% losses in the previous day, trading around $80.10 per barrel during the Asian hours on Tuesday.
goTop
quote