Silver Price Analysis: XAG/USD languishes near two-week low, seems vulnerable to slide further

Source Fxstreet
  • Silver drops to a two-week low on Wednesday, albeit manages to hold above the 38.2% Fibo.
  • The mixed technical setup warrants some caution before positioning for any further downfall.
  • Any attempted recovery might confront a stiff barrier and remain capped near the $25.00 mark.

Silver (XAG/USD) oscillates in a narrow trading band through the first half of the European session and consolidates its recent losses to a two-week low touched earlier this Wednesday. The white metal currently trades just below the mid-$24.00s and seems vulnerable to prolonging its recent pullback from the YTD peak touched last week.

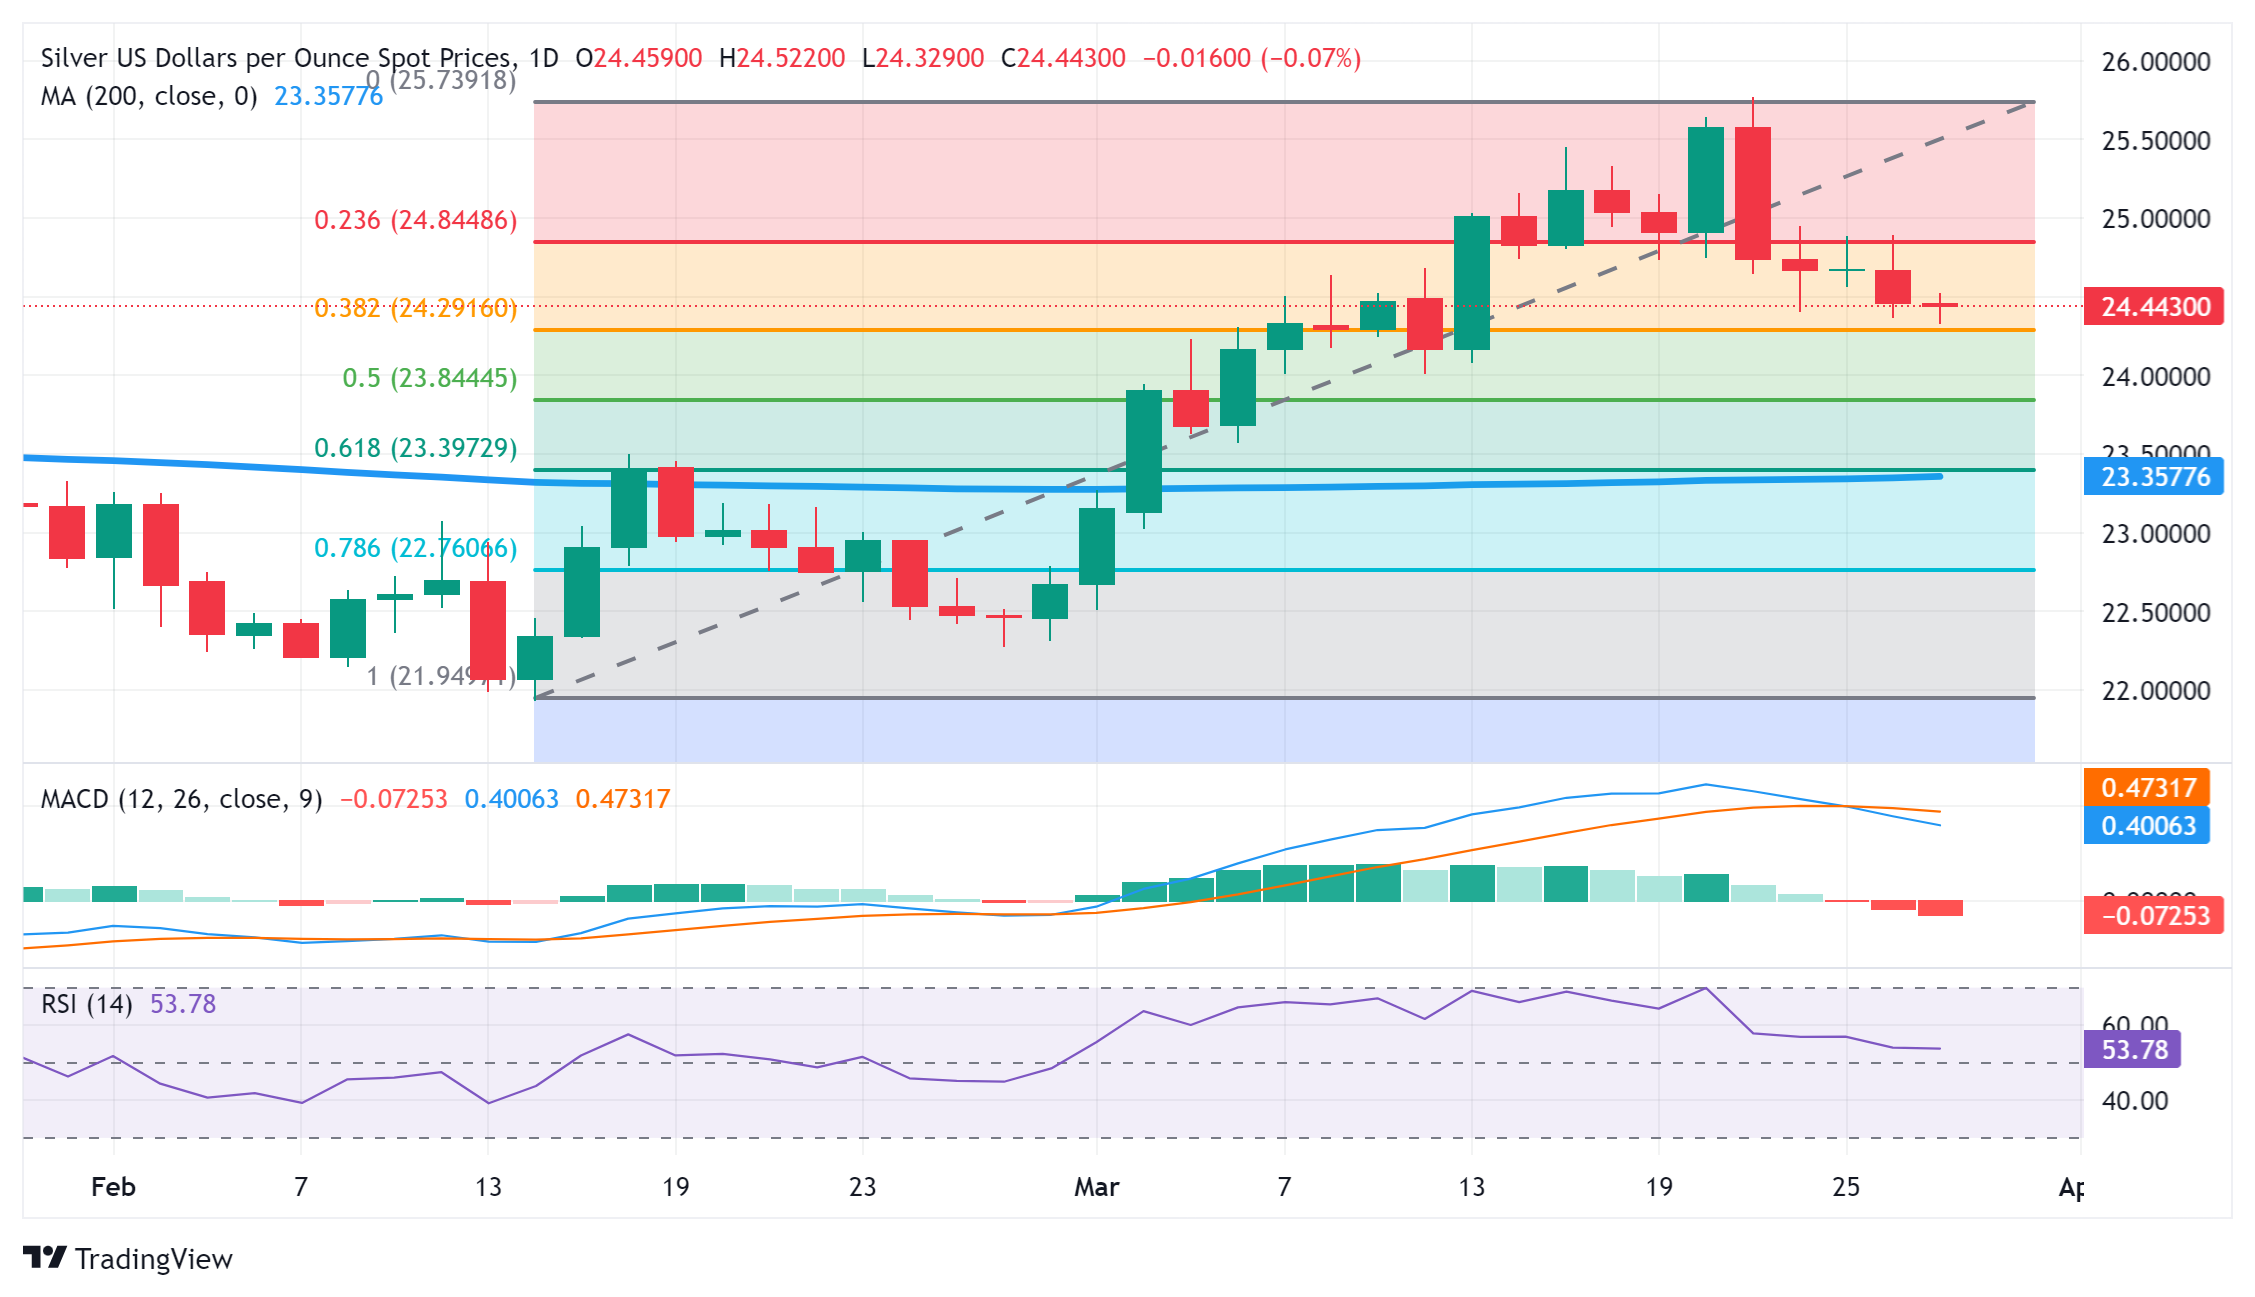
That said, mixed technical indicators on the daily chart and failure to break through the 38.2% Fibonacci retracement level of the February-March rally, warrant some caution for aggressive bearish traders. Hence, it will be prudent to wait for some follow-through selling below the $24.30 support zone before positioning for a further depreciating move. The XAG/USD might then weaken further below the $24.00 round-figure mark and test the 50% Fibo. level near the $23.85 zone.

The subsequent downfall has the potential to drag the white metal to the $23.40 confluence, comprising the 61.8% Fibo. and the very important 200-day Simple Moving Average (SMA), en route to the $23.00 round-figure mark. Failure to defend the latter might expose the next relevant support near the $22.45 region.

On the flip side, any attempted recovery is likely to attract fresh sellers and remain capped near the $25.00 psychological mark. That said, a sustained strength beyond the said handle might trigger a bout of a short-covering rally and lift the XAG/USD to the $25.50 region en route to the YTD peak, around the $25.75-$25.80 region. This is followed by the December 2023 swing high, just ahead of the $26.00 round figure, which if cleared will set the stage for additional near-term gains.

Silver daily chart

fxsoriginal

XAG/USD

Overview
Today last price 24.44
Today Daily Change -0.02
Today Daily Change % -0.08
Today daily open 24.46
 
Trends
Daily SMA20 24.32
Daily SMA50 23.35
Daily SMA100 23.51
Daily SMA200 23.35
 
Levels
Previous Daily High 24.89
Previous Daily Low 24.37
Previous Weekly High 25.77
Previous Weekly Low 24.4
Previous Monthly High 23.5
Previous Monthly Low 21.93
Daily Fibonacci 38.2% 24.57
Daily Fibonacci 61.8% 24.69
Daily Pivot Point S1 24.25
Daily Pivot Point S2 24.05
Daily Pivot Point S3 23.73
Daily Pivot Point R1 24.78
Daily Pivot Point R2 25.1
Daily Pivot Point R3 25.31


Disclaimer: For information purposes only. Past performance is not indicative of future results.
placeholder
US Q4 Earnings Season Set to Begin: Can US December CPI Data Bolster Rate Cut Case? [Weekly Preview]U.S. stocks kicked off 2026 with a rally as the market bets on economic growth and remains optimistic that the Federal Reserve will further cut interest rates this year. The fourth-quarte
Author  TradingKey
6 hours ago
U.S. stocks kicked off 2026 with a rally as the market bets on economic growth and remains optimistic that the Federal Reserve will further cut interest rates this year. The fourth-quarte
placeholder
Solana Future: From high-speed experiment to corporate treasury playbook for the next SOL cycleSolana’s Proof of History architecture is colliding with rising institutional treasury adoption and governance scrutiny, with SOL’s next cycle hinging on validator distribution, stability, and regulated capital access.
Author  Mitrade
8 hours ago
Solana’s Proof of History architecture is colliding with rising institutional treasury adoption and governance scrutiny, with SOL’s next cycle hinging on validator distribution, stability, and regulated capital access.
placeholder
WTI maintains position above $59.00 as supply risks growWest Texas Intermediate (WTI) Oil price extends its gains for the third successive session, trading around $59.10 per barrel during the Asian hours on Monday. Crude Oil prices rise as supply risks grow amid escalating protests in Iran.
Author  FXStreet
9 hours ago
West Texas Intermediate (WTI) Oil price extends its gains for the third successive session, trading around $59.10 per barrel during the Asian hours on Monday. Crude Oil prices rise as supply risks grow amid escalating protests in Iran.
placeholder
Trump’s Tariff Ruling Lands Today: Market to Rise or Fall — The Decision Will TellGlobal financial markets demonstrated strong performance at the beginning of 2026, fostering an optimistic atmosphere for early-year trading; however, this upward trend may face its first
Author  TradingKey
Jan 09, Fri
Global financial markets demonstrated strong performance at the beginning of 2026, fostering an optimistic atmosphere for early-year trading; however, this upward trend may face its first
placeholder
Top 3 Price Prediction: Bitcoin, Ethereum, Ripple — BTC, ETH and XRP defend key support as rebound scenario stays in playBTC holds above $90,000, ETH hovers near $3,128 at the 50-day EMA, and XRP steadies above $2.07 as traders weigh rebound targets and key downside levels.
Author  Mitrade
Jan 09, Fri
BTC holds above $90,000, ETH hovers near $3,128 at the 50-day EMA, and XRP steadies above $2.07 as traders weigh rebound targets and key downside levels.
Related Instrument
goTop
quote