


Natural Gas rallies as attacks on Russian, Ukrainian facilities intensify
- Natural Gas prices are soaring by 2% on Tuesday.
- Traders are sending gas prices higher after both Russia and Ukraine attacked gas storage facilities on both sides.
- The US Dollar Index eases further and could soon test 104.00.
Natural Gas (XNG/USD) trades higher on Tuesday after attacks between Ukraine and Russia, targeting both Gas and Oil storage facilities, intensified over the weekend. Meanwhile, in the Middle-East, the understanding between the US and Israel is falling back to a low level after the US abstained from vetoing the ceasefire deal in the UN Security Council. This heightens tensions in both the Middle East and Ukraine, with investors pricing in the possibility of increasing supply disruptions.
Meanwhile, the DXY US Dollar Index is descending for the second day in a row this week. Traders are sending the Greenback lower with some help from the People’s Bank of China (PBoC), which set a stronger Yuan fixing for a second day in a row. Adding to this, markets are doubting that the US Federal Reserve will cut interest rates three times this year after recent inflation numbers pointed to an uptick. The Greenback is also seeing some profit taking after its stellar performance last week.
Natural Gas is trading at $1.87 per MMBtu at the time of writing.
Natural Gas news and market movers: Ukraine attacks intensify
- Missile attacks between Russia and Ukraine are intensifying with Russia targeting energy and Gas storage facilities in the country.
- Petroleum Minister Musadik Malik said, Bloomberg reports, that Pakistan's Prime Minister Shehbaz Sharif is planning to ask the US administration for a sanction waiver for “political and technical” reasons to secure the waivers. Pakistan signed a 25-year deal for a Gas pipeline with Iran.
- Shipbuilder Hanwha Ocean Co. told Bloomberg it might face serious losses after it is unable to find new buyers for specialized vessels built to serve a Russian liquefied natural gas facility that it is now subject to sanctions. The ships are so specific they would only be bought by third parties that will still want to work with the Russian Gas facility.
- Gazprom PJSC reported that it has begun constructing natural Gas lines to integrate the Power of Siberia pipeline with the Far East’s local gas distribution network. This way Siberian gas would soon flow towards China and the broader region.
Natural Gas Technical Analysis: Consolidation breakout
Natural Gas prices are no longer consolidating with a breakout at hand on Tuesday. From a technical perspective, a runup higher should follow suit. With Russia building up further pressure on Ukraine and Israel feeling left behind by the US, supply risk increases, with a quick rally to $2.00 possible.
On the upside, the key $2.00 level needs to be regained first, with the 55-day Simple Moving Average (SMA) coming in as well. The next key mark is the historic pivotal point at $2.13. Should Gas prices pop up in that region, a broad area opens up with the first cap at the red descending trend line near $2.21.
On the downside, multi-year lows are still nearby with $1.65 as the first line in the sand. This year’s low at $1.60 needs to be kept an eye on as well. Once a new low for the year is printed, traders should look at $1.53 as the next supportive area.
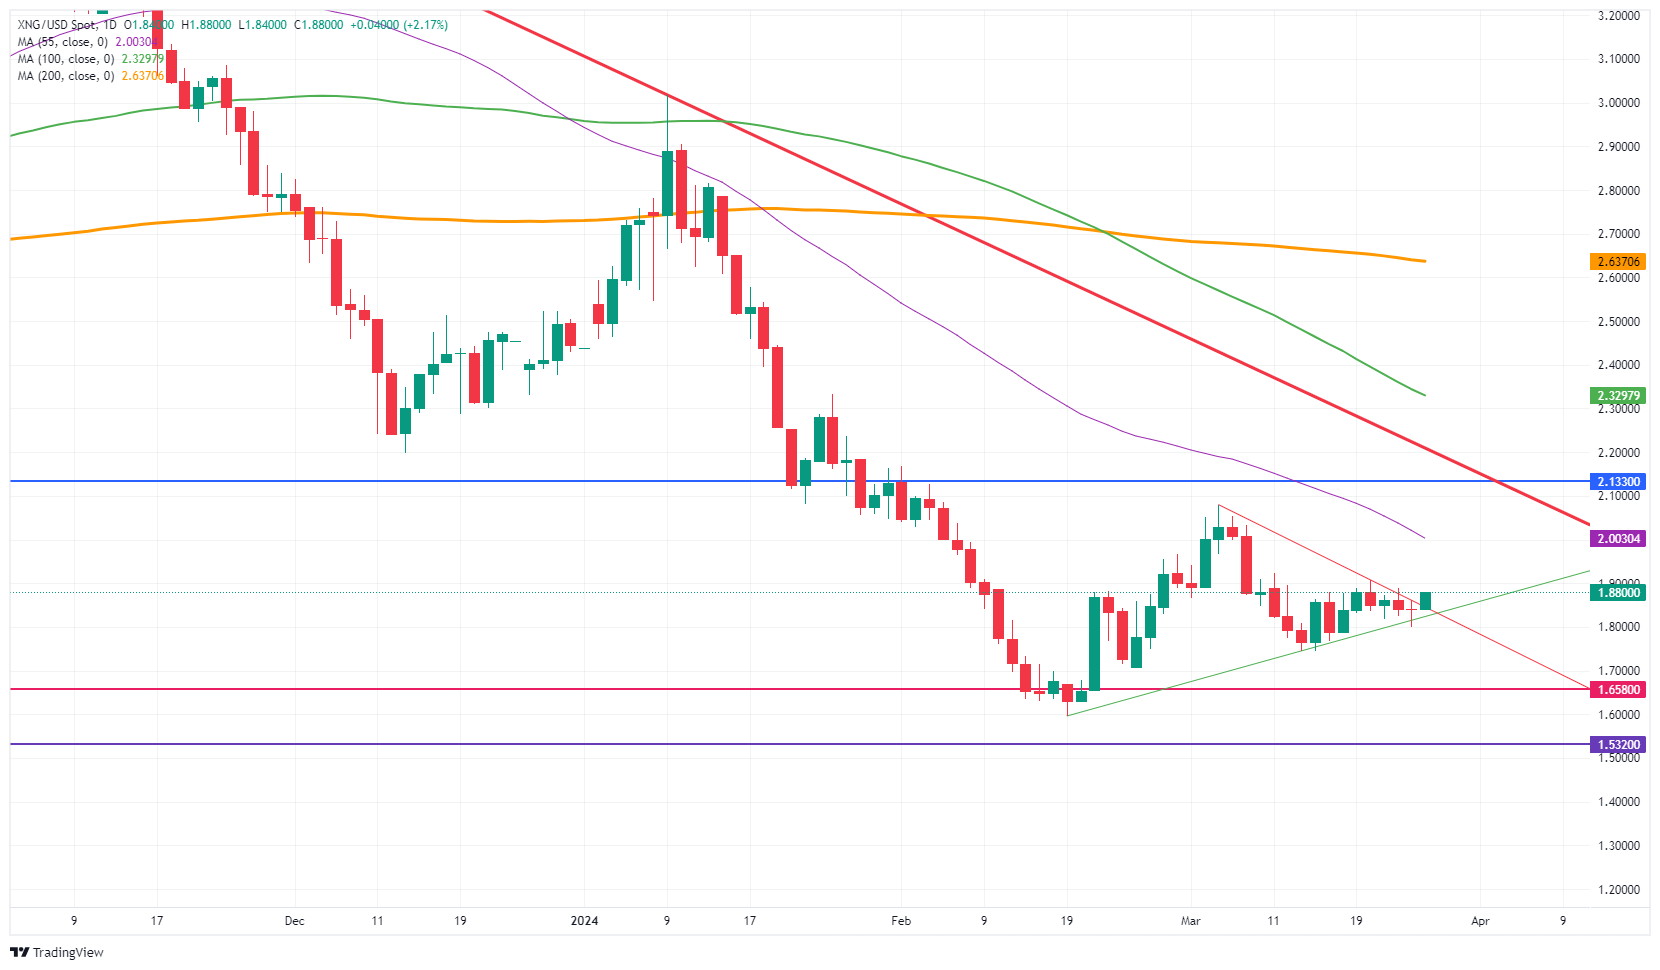
Natural Gas: Daily Chart
Natural Gas FAQs
Supply and demand dynamics are a key factor influencing Natural Gas prices, and are themselves influenced by global economic growth, industrial activity, population growth, production levels, and inventories. The weather impacts Natural Gas prices because more Gas is used during cold winters and hot summers for heating and cooling. Competition from other energy sources impacts prices as consumers may switch to cheaper sources. Geopolitical events are factors as exemplified by the war in Ukraine. Government policies relating to extraction, transportation, and environmental issues also impact prices.
The main economic release influencing Natural Gas prices is the weekly inventory bulletin from the Energy Information Administration (EIA), a US government agency that produces US gas market data. The EIA Gas bulletin usually comes out on Thursday at 14:30 GMT, a day after the EIA publishes its weekly Oil bulletin. Economic data from large consumers of Natural Gas can impact supply and demand, the largest of which include China, Germany and Japan. Natural Gas is primarily priced and traded in US Dollars, thus economic releases impacting the US Dollar are also factors.
The US Dollar is the world’s reserve currency and most commodities, including Natural Gas are priced and traded on international markets in US Dollars. As such, the value of the US Dollar is a factor in the price of Natural Gas, because if the Dollar strengthens it means less Dollars are required to buy the same volume of Gas (the price falls), and vice versa if USD strengthens.
Recommended Articles


