


Gold price advances as Fed remains confident on easing inflation
- Gold price climbs to $2,190 as the US Dollar drops with eyes on US core PCE inflation data.
- The Fed remains confident that inflation is broadly easing despite recent hot readings.
- The US yields fall as expectations for the Fed lowering interest rates from June rebound.
Gold price (XAU/USD) jumps above a two-day high near $2,190 in Tuesday’s European session as the US Dollar corrects. The US Dollar faces downward pressure as Federal Reserve (Fed) policymakers seem to be growing confident about easing price pressures, foreseeing three interest-rate cuts this year despite hot inflation readings in January and February.
Investors look for fresh cues about the inflation outlook to know when the Federal Reserve will start reducing interest rates. The market participants will keenly focus on the United States core Personal Consumption Expenditure price index (PCE) data for February, which will be published on Friday.
Evidence of easing price pressures could strengthen Gold prices as it will diminish hopes for the Fed to keep interest rates higher for a longer period. However, stubborn inflation data will negatively impact the Gold price as it will increase the opportunity cost of investing in it. Instead, investors could opt for interest-bearing assets such as bonds, whose appeal would increase due to higher yields. At the press time, 10-year US Treasury yields drop to 4.24% on firm expectations that the Fed will start reducing interest rates from June.
Daily digest market movers: Gold price advances as US Dollar corrects
- Gold price rises to $2,190, capitalizing on a modest correction in the US Dollar. The precious metal jumps higher as Federal Reserve policymakers look set to lower interest rates in June amid increasing evidence that inflation is moving in the right direction. The US Dollar Index (DXY), which measures the US Dollar’s value against six major currencies, falls from a one-month high of 104.50 to 104.10.
- The Fed is confident about easing inflationary pressures even though price pressures turned out hotter than expected in the first two months of 2024. Fed Governor Lisa Cook said in an event hosted by Harvard University on Monday, "Although housing-services inflation remains quite high, the current low rate of increase on new rental leases suggests that it will continue to fall." Cook endorsed a cautious approach when asked about monetary policy easing.
- Separately, Chicago Fed Bank President Austan Goolsbee said in an interview with Yahoo Finance on Monday that the inflation situation is uncertain due to higher housing inflation. However, he is confident that the fundamental story of inflation returning to the 2% target has not changed.
- Last week, the Fed stuck with projections of reducing interest rates three times this year. This has reinforced market expectations for the Fed to cut interest rates from the June policy meeting. According to the CME FedWatch tool, there is an almost 70% chance that a rate cut will be announced in June. The chances were at 60% last week before the Fed’s policy announcement. Increased Fed rate cut expectations have kept the downside in the Gold price limited.
- This week, investors will shift focus to the core PCE price index data for February to know more about Fed rate-cut timing. The annual core PCE reading is anticipated to have grown steadily by 2.8%. The monthly inflation data is expected to have risen by 0.3%, slower than the 0.4% increase seen in January.
Technical Analysis: Gold price finds support near $2,160
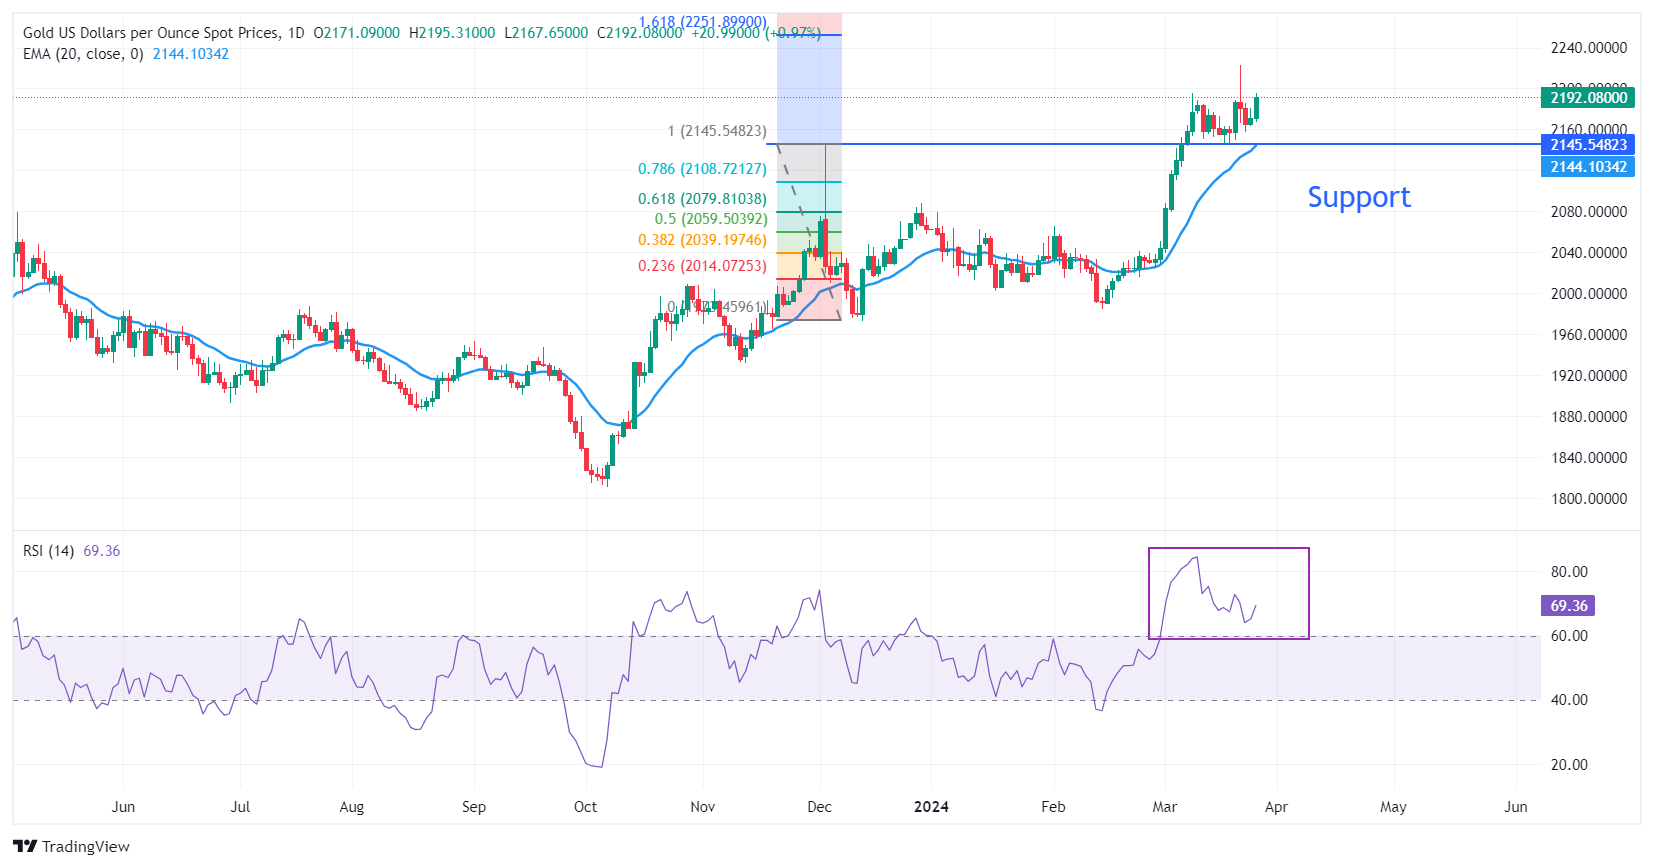
Gold price recovers to $2,190 as momentum oscillators rebound. The 14-period Relative Strength Index (RSI) edges up after dropping to 64.00. Last week, the Gold price corrected sharply from all-time highs of $2,223 as oscillators showed extremely overbought signals.
The near-term demand for the Gold price is bullish as the 20-day Exponential Moving Average (EMA) at $2,145 is sloping higher.
On the upside, the Gold price could face resistance near the 161.8% Fibonacci extension level at $2,250. The Fibonacci tool is plotted from December 4 high at $2,144.48 to December 13 low at $1,973.13. On the downside, December 4 high at $2,144.48 will likely support the Gold price bulls.
Gold FAQs
Gold has played a key role in human’s history as it has been widely used as a store of value and medium of exchange. Currently, apart from its shine and usage for jewelry, the precious metal is widely seen as a safe-haven asset, meaning that it is considered a good investment during turbulent times. Gold is also widely seen as a hedge against inflation and against depreciating currencies as it doesn’t rely on any specific issuer or government.
Central banks are the biggest Gold holders. In their aim to support their currencies in turbulent times, central banks tend to diversify their reserves and buy Gold to improve the perceived strength of the economy and the currency. High Gold reserves can be a source of trust for a country’s solvency. Central banks added 1,136 tonnes of Gold worth around $70 billion to their reserves in 2022, according to data from the World Gold Council. This is the highest yearly purchase since records began. Central banks from emerging economies such as China, India and Turkey are quickly increasing their Gold reserves.
Gold has an inverse correlation with the US Dollar and US Treasuries, which are both major reserve and safe-haven assets. When the Dollar depreciates, Gold tends to rise, enabling investors and central banks to diversify their assets in turbulent times. Gold is also inversely correlated with risk assets. A rally in the stock market tends to weaken Gold price, while sell-offs in riskier markets tend to favor the precious metal.
The price can move due to a wide range of factors. Geopolitical instability or fears of a deep recession can quickly make Gold price escalate due to its safe-haven status. As a yield-less asset, Gold tends to rise with lower interest rates, while higher cost of money usually weighs down on the yellow metal. Still, most moves depend on how the US Dollar (USD) behaves as the asset is priced in dollars (XAU/USD). A strong Dollar tends to keep the price of Gold controlled, whereas a weaker Dollar is likely to push Gold prices up.
Recommended Articles


