Silver Price Analysis: XAG/USD bears need to wait for break below 38.2% Fibo. near $24.30

Source Fxstreet
  • Silver meets with a fresh supply on Tuesday and drops closer to last week’s swing low.
  • The setup suggests that the path of least resistance for the XAU/USD is to the downside.
  • A sustained break below the 38.2% Fibo. will reinforce the near-term negative outlook.

Silver (XAG/USD) comes under some selling pressure on Tuesday and remains depressed near mid-$24.00s through the first half of the European session. Meanwhile, the technical setup seems tilted in favour of bearish traders and supports prospects for an extension of last week's sharp retracement slide from the $25.75-$25.80 region, or its highest level since early December.

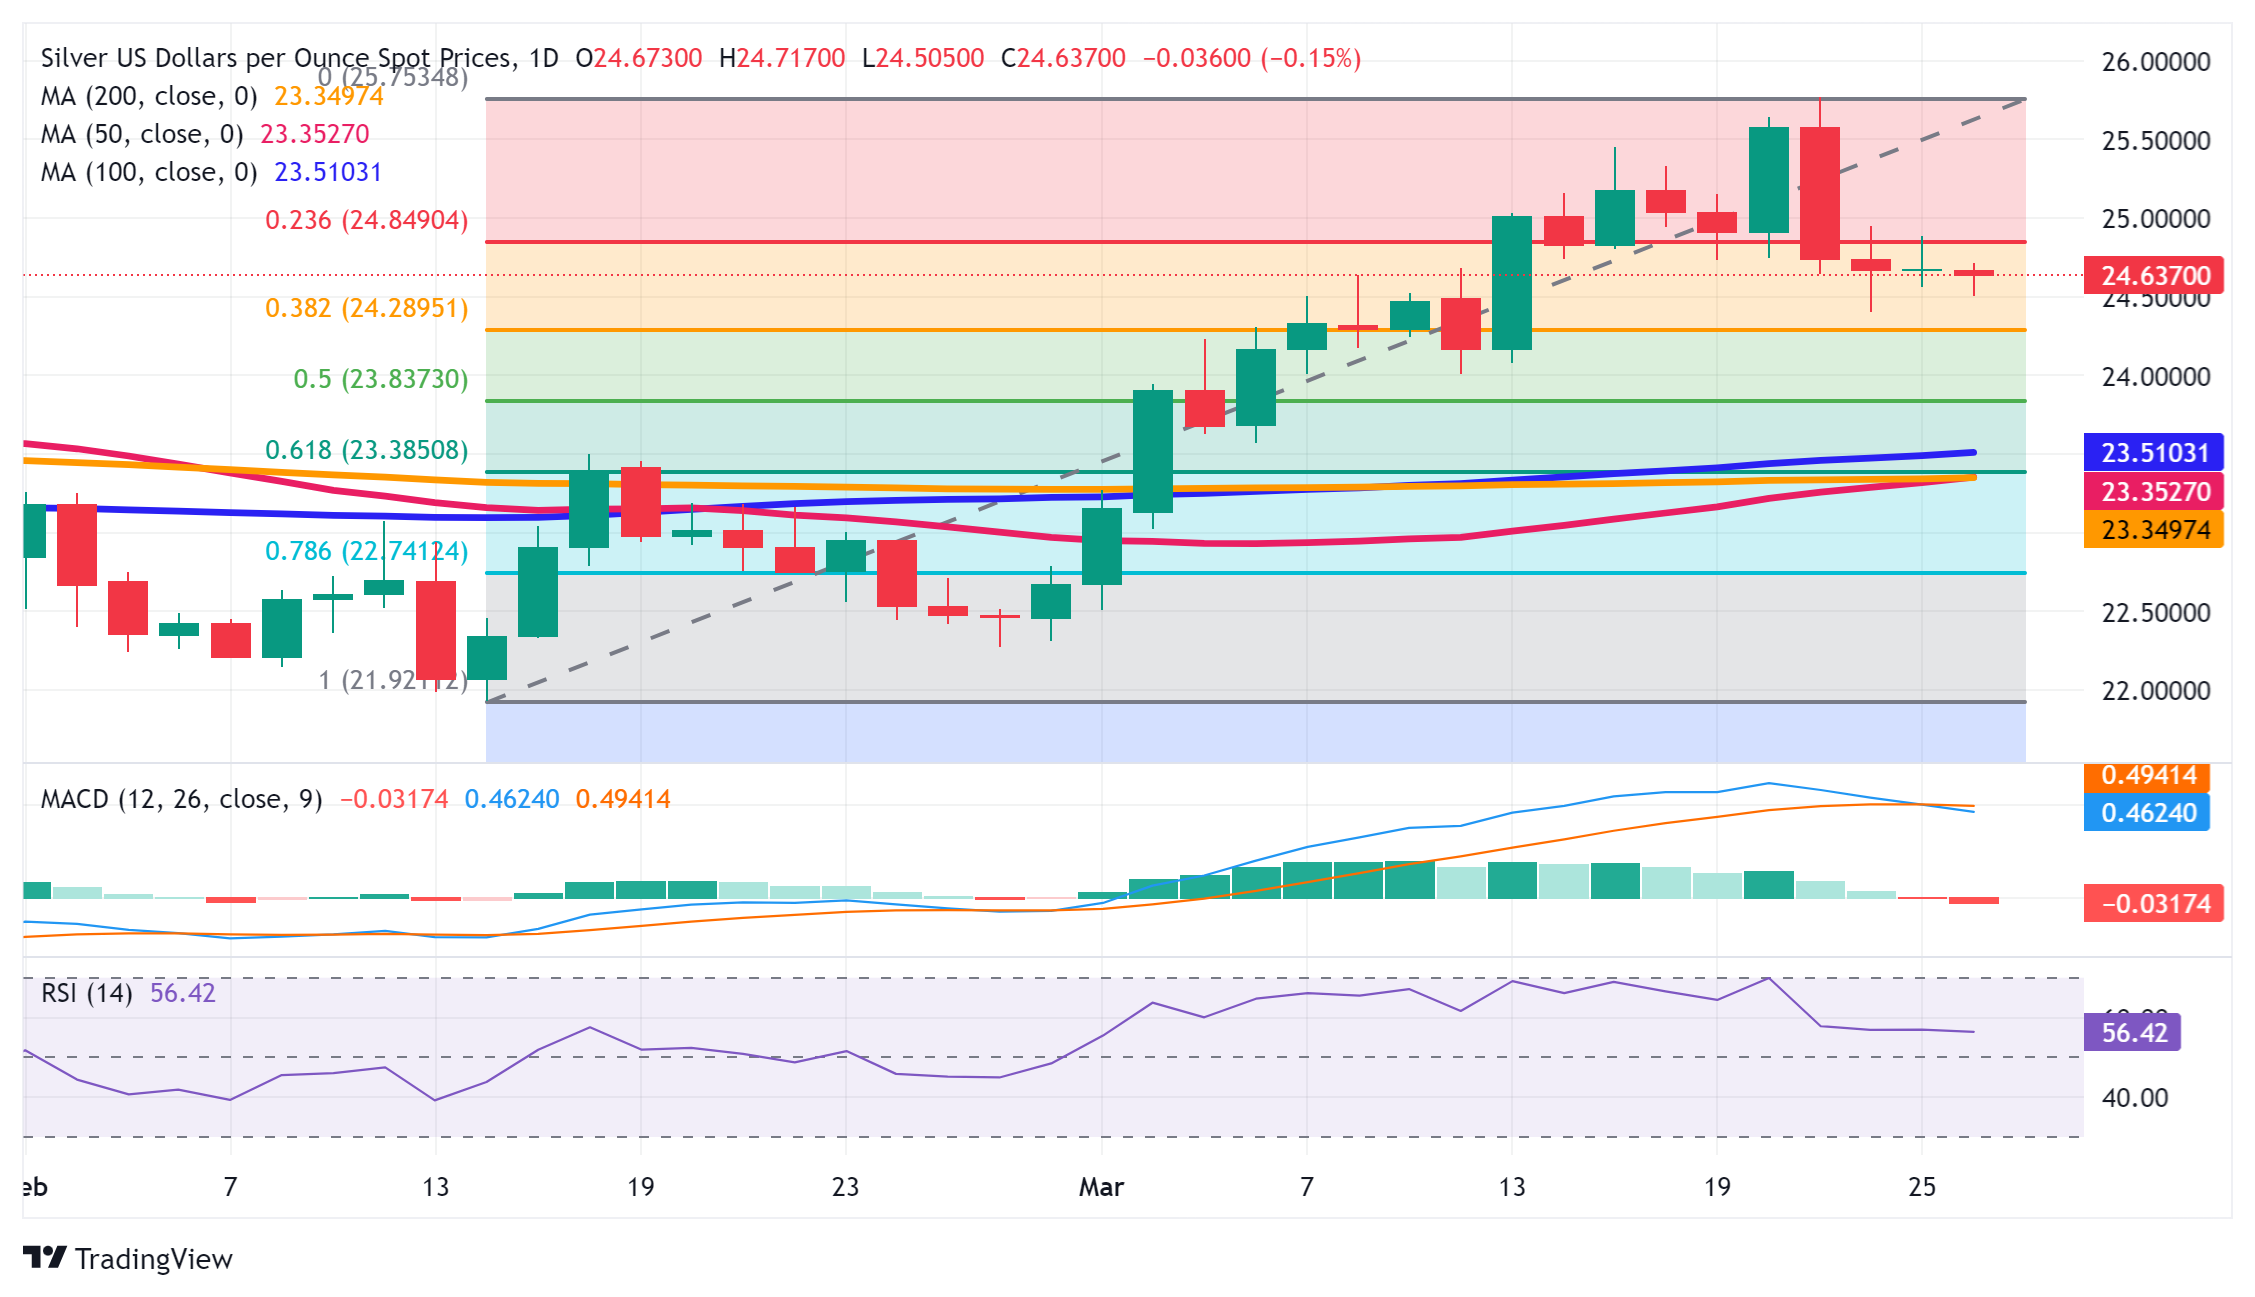
The XAG/USD now seems to have found acceptance below the $24.85-$24.80 horizontal support, which coincides with the 23.6% Fibonacci retracement level of the February-March rally. The subsequent slide, however, stalled near the $24.40 area, just ahead of the 38.2% Fibo. level, which should now act as a key pivotal point. Meanwhile, mixed oscillators on the daily chart make it prudent to wait for some follow-through selling below the said support before positioning for any further losses.

The XAG/USD might then accelerate the corrective decline further towards the $24.00 round figure before dropping to 50% Fibo. level support, around the $23.85 region. This is followed by the $23.35 confluence, comprising the 61.8% Fibo. and the very important 200-day Simple Moving Average (SMA). A convincing break below the latter will be seen as a fresh trigger for bearish traders and drag the white metal below the $23.00 mark, towards the next relevant support near the $22.45 region.

On the flip side, any attempted recovery is likely to attract fresh sellers and remain capped near the $25.00 psychological mark. That said, a sustained strength beyond the said handle might trigger a bout of a short-covering rally and lift the XAG/USD to the $25.50 region en route to the YTD peak, around the $25.75-$25.80 region. This is followed by the December 2023 swing high, just ahead of the $26.00 round figure, which if cleared decisively will set the stage for a further near-term appreciating move.

Silver daily chart

fxsoriginal

XAG/USD

Overview
Today last price 24.63
Today Daily Change -0.04
Today Daily Change % -0.16
Today daily open 24.67
 
Trends
Daily SMA20 24.22
Daily SMA50 23.32
Daily SMA100 23.49
Daily SMA200 23.34
 
Levels
Previous Daily High 24.89
Previous Daily Low 24.56
Previous Weekly High 25.77
Previous Weekly Low 24.4
Previous Monthly High 23.5
Previous Monthly Low 21.93
Daily Fibonacci 38.2% 24.76
Daily Fibonacci 61.8% 24.69
Daily Pivot Point S1 24.53
Daily Pivot Point S2 24.38
Daily Pivot Point S3 24.2
Daily Pivot Point R1 24.85
Daily Pivot Point R2 25.04
Daily Pivot Point R3 25.18


Disclaimer: For information purposes only. Past performance is not indicative of future results.
placeholder
Geopolitical Premium Strikes Back. Hormuz Strait Reopening Faces Changes, Bitcoin Barely Holds 70,000 Psychological LevelMiddle East tensions escalate ahead of negotiations, causing Bitcoin to pull back after a surge, with $70,000 becoming the watershed between bulls and bears.On April 9, unexpected develop
Author  TradingKey
14 hours ago
Middle East tensions escalate ahead of negotiations, causing Bitcoin to pull back after a surge, with $70,000 becoming the watershed between bulls and bears.On April 9, unexpected develop
placeholder
Strait of Hormuz Closes Again, When Will Global Energy Supply See Light Again?The outlook for navigation through the Strait of Hormuz remains clouded by uncertainty, as the newly reached ceasefire agreement has failed to bring stability to this global energy choke
Author  TradingKey
14 hours ago
The outlook for navigation through the Strait of Hormuz remains clouded by uncertainty, as the newly reached ceasefire agreement has failed to bring stability to this global energy choke
placeholder
Gold edges lower below $4,750 amid fragile Middle East ceasefire Gold price (XAU/USD) trades in negative territory around $4,705 during the early Asian session on Thursday. The precious metal edges lower amid a temporary two-week ceasefire between the US and Iran.   
Author  FXStreet
14 hours ago
Gold price (XAU/USD) trades in negative territory around $4,705 during the early Asian session on Thursday. The precious metal edges lower amid a temporary two-week ceasefire between the US and Iran.   
placeholder
Gold remains depressed as skepticism over US-Iran truce supports USDGold (XAU/USD) once again shows some resilience below the $4,700 mark during the Asian session on Thursday, and for now, seems to have stalled the previous day's retracement slide from a three-week high.
Author  FXStreet
17 hours ago
Gold (XAU/USD) once again shows some resilience below the $4,700 mark during the Asian session on Thursday, and for now, seems to have stalled the previous day's retracement slide from a three-week high.
placeholder
U.S.-Iran Ceasefire. Bitcoin Surges Past $72,000, 80,000 Within Reach?The U.S.-Iran ceasefire agreement triggered a surge in Bitcoin of over 4%, with the Islamabad negotiations starting this Friday serving as a key driver for further gains.On April 8, a bri
Author  TradingKey
Yesterday 10: 12
The U.S.-Iran ceasefire agreement triggered a surge in Bitcoin of over 4%, with the Islamabad negotiations starting this Friday serving as a key driver for further gains.On April 8, a bri
Related Instrument
goTop
quote