

Gold price edges down from all-time highs as US Dollar, Treasury yields revive
- Gold price falls sharply as the US Dollar, bond yields bounce back.
- Fed remains stuck with projections of three rate cuts this year.
- An improved US economic outlook empowers US Dollar to lick wounds.
Gold price (XAU/USD) drops from fresh all-time highs around $2,220 in Thursday’s early American session as US Dollar and US Treasury yields rebound strongly. The US Dollar Index (DXY), which tracks the Greenback’s value against six major currencies, rebounds to 103.50 after a decline seen post-release of the Federal Reserve's (Fed) dot plot. It seems that upwardly revised forecasts for the Gross Domestic Product (GDP) and the annual Core Personal Consumption Expenditure Price Index (PCE) for 2024 have limited the US Dollar’s downside. An improving US economic outlook bodes well for the US Dollar. 10-year US Treasury yields rebound to 4.27% as the Fed refrains from providing any concrete timing for Fed rate cuts.
Earlier, the Gold price refreshes all-time highs as speculation over Fed rate cut hopes for June escalated after the quarterly updated dot plot of March’s policy meeting showed that three rate cut projections for this year remain on the table. Comments from Fed Chair Jerome Powell also helped to firm demand for Gold. Powell said policymakers are confident that underlying inflation is easing despite sticky February’s inflation numbers. Firm expectations for the Fed reducing interest rates diminish the opportunity cost of holding investment in non-yielding assets such as Gold.
Daily digest market movers: Gold price falls as US yields rebounds strongly
- Gold price falls sharply after refreshing all-time highs at around $2,223 as the US Dollar rebounds from a five-day low of 103.17.
- The demand for Gold is broadly bullish as the Federal Reserve indicated that inflation is moving in the right direction. The Fed is confident that underlying price pressures are easing despite inflation remaining stubborn in the first two months this year. Fed officials project the annual Core PCE Price Index at 2.6% in 2024, higher than the 2.4% anticipated in December’s policy meeting.
- The updated Fed’s dot plot indicated that December’s projections of three rate cuts in 2024 remain on track. Nine out of 19 policymakers support lowering interest rates three times this year, while one had projected more than three. The remaining policymakers anticipated having two or fewer rate cuts in the same period.
- This has uplifted expectations for the Fed reducing interest rates from the June policy meeting. The CME FedWatch tool shows that there is a little over 74% chance that a rate cut will be announced in June, which is significantly up from 59% recorded before the Fed’s meeting.
- While the Fed’s projection for lowering interest rates three times this year remains intact, median rate projections for 2025 and 2026 have increased to 2.9% and 3.1%, respectively. The median projections for the longer-term rate have also increased to 2.6%.
- Regarding the United States economic outlook, the Fed sees the Unemployment Rate at 4.0% by 2024, down from 4.1% anticipated in December. Meanwhile, forecasts for the 2024 Gross Domestic Product (GDP) have been upwardly revised to 2.1% from the 1.4% projected in December.
Technical Analysis: Gold price slumps from fresh all-time highs near $2,220
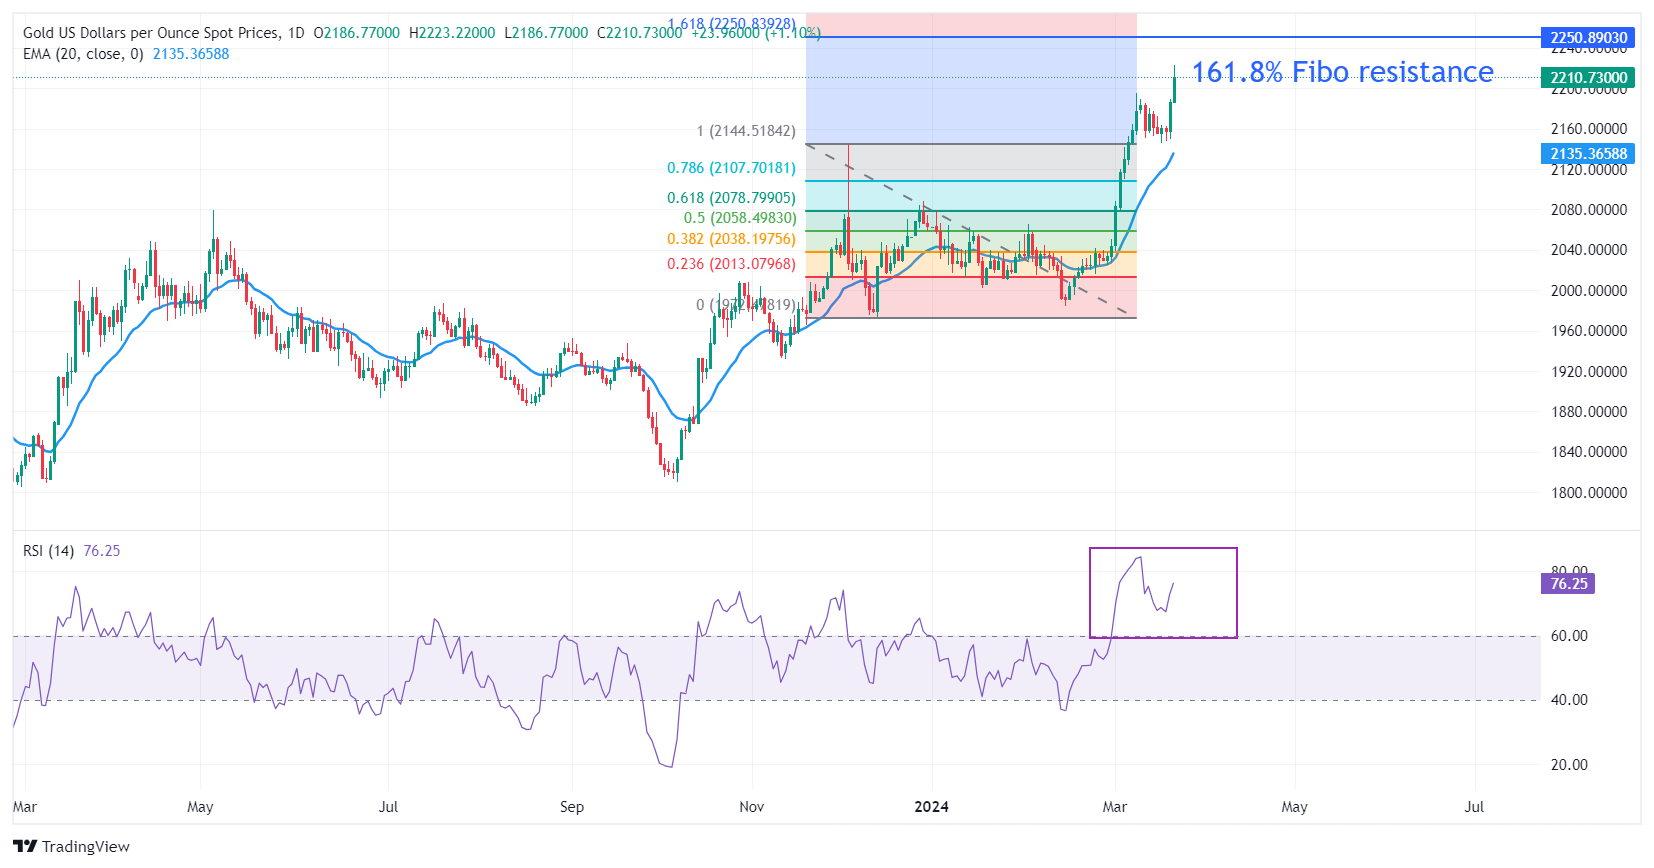
Gold price dips below $2,180 from all-time highs around $2,220. The short-term demand for the Gold price is extremely bullish as the 20-day Exponential Moving Average (EMA) at $2,137 is sloping higher vertically.
The Gold price is trading in unchartered territory but could face resistance near the 161.8% Fibonacci extension level at $2,250. The Fibonacci tool is plotted from December 4 high at $2,144.48 to December 13 low at $1,973.13. On the downside, December 4 high at $2,144.48 will be a major support for the Gold price bulls.
The 14-period Relative Strength Index (RSI) oscillates in the bullish range of 60.00-80.00, indicating more upside ahead.
Fed FAQs
Monetary policy in the US is shaped by the Federal Reserve (Fed). The Fed has two mandates: to achieve price stability and foster full employment. Its primary tool to achieve these goals is by adjusting interest rates. When prices are rising too quickly and inflation is above the Fed’s 2% target, it raises interest rates, increasing borrowing costs throughout the economy. This results in a stronger US Dollar (USD) as it makes the US a more attractive place for international investors to park their money. When inflation falls below 2% or the Unemployment Rate is too high, the Fed may lower interest rates to encourage borrowing, which weighs on the Greenback.
The Federal Reserve (Fed) holds eight policy meetings a year, where the Federal Open Market Committee (FOMC) assesses economic conditions and makes monetary policy decisions. The FOMC is attended by twelve Fed officials – the seven members of the Board of Governors, the president of the Federal Reserve Bank of New York, and four of the remaining eleven regional Reserve Bank presidents, who serve one-year terms on a rotating basis.
In extreme situations, the Federal Reserve may resort to a policy named Quantitative Easing (QE). QE is the process by which the Fed substantially increases the flow of credit in a stuck financial system. It is a non-standard policy measure used during crises or when inflation is extremely low. It was the Fed’s weapon of choice during the Great Financial Crisis in 2008. It involves the Fed printing more Dollars and using them to buy high grade bonds from financial institutions. QE usually weakens the US Dollar.
Quantitative tightening (QT) is the reverse process of QE, whereby the Federal Reserve stops buying bonds from financial institutions and does not reinvest the principal from the bonds it holds maturing, to purchase new bonds. It is usually positive for the value of the US Dollar.
Recommended Articles


