NZD/JPY Price Analysis: Bulls add gains and indicators reach overbought conditions

Source Fxstreet
  • The positive outlook on the daily chart improved but bulls aren’t yet in command.
  • the RSI was seen above 70 in recent hours, which may lead to a consolidation.
  • To prevent any potential losses, the bulls must defend the key SMAs.

In Tuesday's session, NZD/JPY is trading at 91.36, registering an uptick of 0.74%. Despite some signals of a consolidation incoming, the market sees dominance by buyers, which leads to a broader bullish outlook. Ahead of the Asian session, the pair may correct overbought conditions on the hourly chart and see some red.

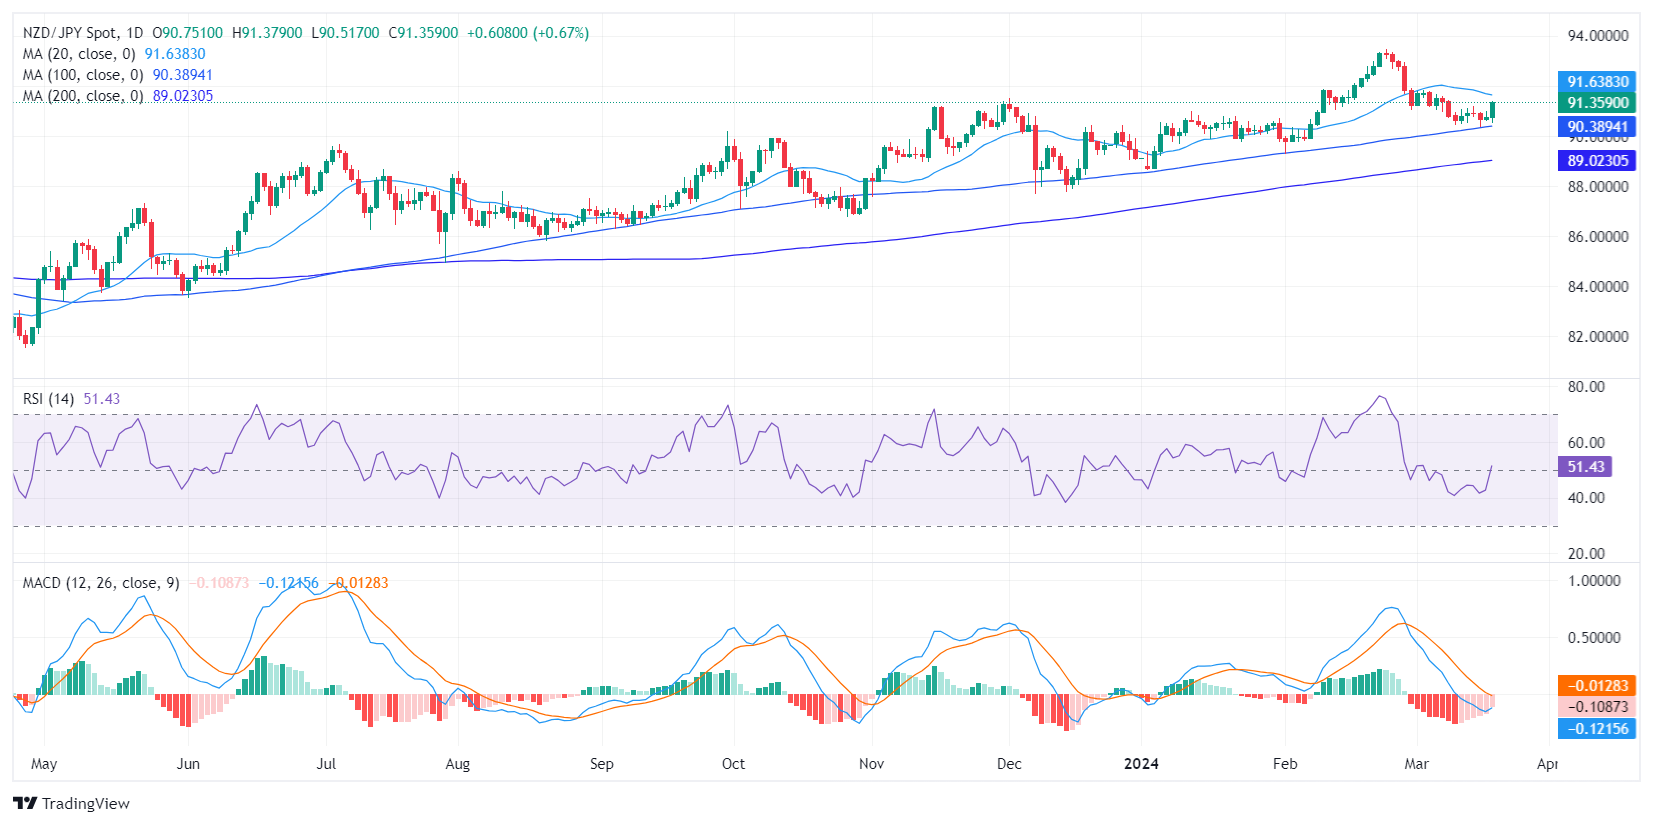
On the daily chart, the NZD/JPY pair posts positive momentum following a shift from the negative territory. The Relative Strength Index (RSI) now sits in the positive territory at 52 while the Moving Average Convergence Divergence (MACD) red bars recede, signaling a potential decrease in negative momentum.

NZD/JPY daily chart
Transitioning to the hourly chart, the NZD/JPY pair displays a stronger positive trend. The RSI enters the overbought territory due to consistent readings above 70. Sharp green bars in the MACD histogram signify strong positive momentum over the past few hours, suggesting buyers dominate the market for now. An RSI above 70 suggests an overextended buying momentum which typically leads to a downward consolidation

NZD/JPY hourly chart
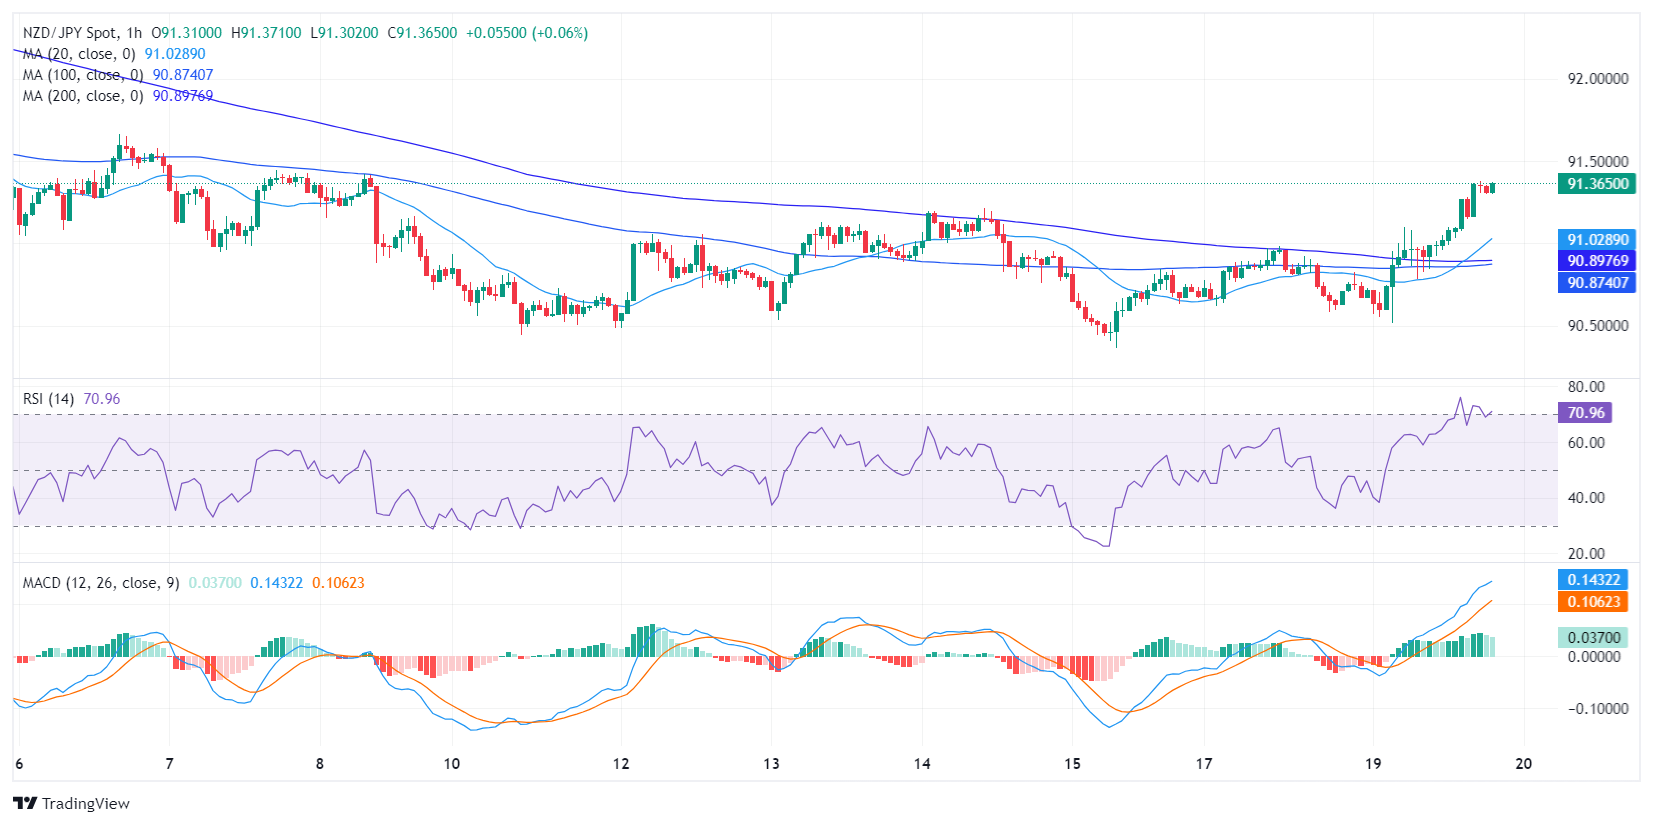
In conclusion, both daily and hourly analyses point to a bullish outlook for the NZD/JPY pair. Traders should monitor the MACD for continued red bar reduction or a shift to green bars, and the RSI to see if it remains within or moves away from the overbought territory in the hourly chart. These data points would suggest a potential price reversal or continuation, respectively.

Regarding a Simple Moving Average (SMA) analysis, despite the bears gaining ground and pushing the pair below the 20-day Simple Moving Average (SMA), the pair remains above the 100 and 200-day SMAs. This pattern suggests that the bulls maintain control of the overall trend.


NZD/JPY

Overview
Today last price 91.35
Today Daily Change 0.60
Today Daily Change % 0.66
Today daily open 90.75
 
Trends
Daily SMA20 91.69
Daily SMA50 91.06
Daily SMA100 90.36
Daily SMA200 89
 
Levels
Previous Daily High 90.99
Previous Daily Low 90.58
Previous Weekly High 91.22
Previous Weekly Low 90.37
Previous Monthly High 93.45
Previous Monthly Low 89.26
Daily Fibonacci 38.2% 90.83
Daily Fibonacci 61.8% 90.74
Daily Pivot Point S1 90.56
Daily Pivot Point S2 90.37
Daily Pivot Point S3 90.15
Daily Pivot Point R1 90.96
Daily Pivot Point R2 91.18
Daily Pivot Point R3 91.37


Disclaimer: For information purposes only. Past performance is not indicative of future results.
placeholder
Why a Quiet 2025 Signals a Massive 2026 Crypto Bull Run: Bitwise CIO ExplainsBitwise's Matt Hougan Predicts a Crypto Boom in 2026 Amid Current Market Struggles
Author  Mitrade
Nov 13, Thu
Bitwise's Matt Hougan Predicts a Crypto Boom in 2026 Amid Current Market Struggles
placeholder
Bitcoin vs. Ethereum: Distinct Monetary UniversesBitcoin and Ethereum are diverging significantly in their monetary roles, according to a joint report from Glassnode and Keyrock.
Author  Mitrade
Yesterday 03: 01
Bitcoin and Ethereum are diverging significantly in their monetary roles, according to a joint report from Glassnode and Keyrock.
placeholder
Ethereum slides 5% as bears lean on $3,500 cap and put $3,150 support in focusEthereum (ETH) drops more than 5% after a failed push above $3,550, with price sliding to $3,153 and now holding below $3,350, the 100-hour SMA and a bearish trend line at $3,500; unless bulls reclaim the $3,350–$3,500 zone, the short-term bias stays bearish and a clean break under $3,150 could expose $3,050, $3,000 and even the $2,880–$2,850 support area.
Author  Mitrade
Yesterday 03: 41
Ethereum (ETH) drops more than 5% after a failed push above $3,550, with price sliding to $3,153 and now holding below $3,350, the 100-hour SMA and a bearish trend line at $3,500; unless bulls reclaim the $3,350–$3,500 zone, the short-term bias stays bearish and a clean break under $3,150 could expose $3,050, $3,000 and even the $2,880–$2,850 support area.
placeholder
Gold Posts Biggest Weekly Gain in a Month as US Data Delays Fuel UncertaintyGold climbed higher on Friday, marking its strongest weekly performance in a month, as traders weighed the impact of a data backlog following the end of the US government's extended shutdown. Silver also moved upward.
Author  Mitrade
Yesterday 05: 48
Gold climbed higher on Friday, marking its strongest weekly performance in a month, as traders weighed the impact of a data backlog following the end of the US government's extended shutdown. Silver also moved upward.
placeholder
Top 3 Price Prediction: Bitcoin, Ethereum, Ripple – BTC, ETH, and XRP flash deeper downside risks as market selloff intensifiesBitcoin (BTC), Ethereum (ETH) and Ripple (XRP) trade in red on Friday after correcting more than 5%, 10% and 2%, respectively, so far this week.
Author  FXStreet
Yesterday 08: 32
Bitcoin (BTC), Ethereum (ETH) and Ripple (XRP) trade in red on Friday after correcting more than 5%, 10% and 2%, respectively, so far this week.
Related Instrument
goTop
quote