
GBP/USD sinks as strong US data, weak UK Retail Sales weigh
- US jobless claims beat forecasts; Durable Goods mixed but signal underlying strength.
- Trump says most trade deals are finalized; EU deal odds seen at 50-50.
- UK Retail Sales rise 0.9% MoM in June, below 1.2% forecast, fueling BoE rate cut bets.
The GBP/USD tumbles to a day's low after clearing the 1.3500 figure, following economic data from the United States (US) that justified the Federal Reserve’s need to maintain its current monetary policy. Conversely, UK Retail Sales disappointed investors after missing the mark. The pair trades at 1.3434, down 0.52%.
Cable drops 0.52% as solid US labor and core orders data offset contraction in manufacturing and UK sales miss
On Thursday, a stronger-than-expected Initial Jobless Claims report highlighted the economy's robustness, although S&P Global reported that manufacturing activity contracted. Recently, US Durable Goods Orders declined due to lower aircraft orders, as reported in a headline of The Wall Street Journal.
Durable Goods, although plunged -9.6% MoM in June from a 16.5% growth in May, it was less than the estimated -10.8% by analysts. Transportation equipment fell by -22.4% in June. Core Durable Goods Orders rose 0.2% for the same period.
In US trade news, President Donald Trump stated that most deals are currently finalized, and the letters to be sent would indicate a 10% to 15% tariff rate. When asked about an agreement with the European Union (EU), he said there’s a 50-50 chance.
Across the pond, UK Retail Sales in June missed expectations, albeit rebounding from a drop in May. Sales rose by 0.9% MoM, below forecasts for a 1.2% growth. In the twelve months to June, it jumped 1.7%, missing estimates for a 1.8% recovery after declining 1.3% the previous month.
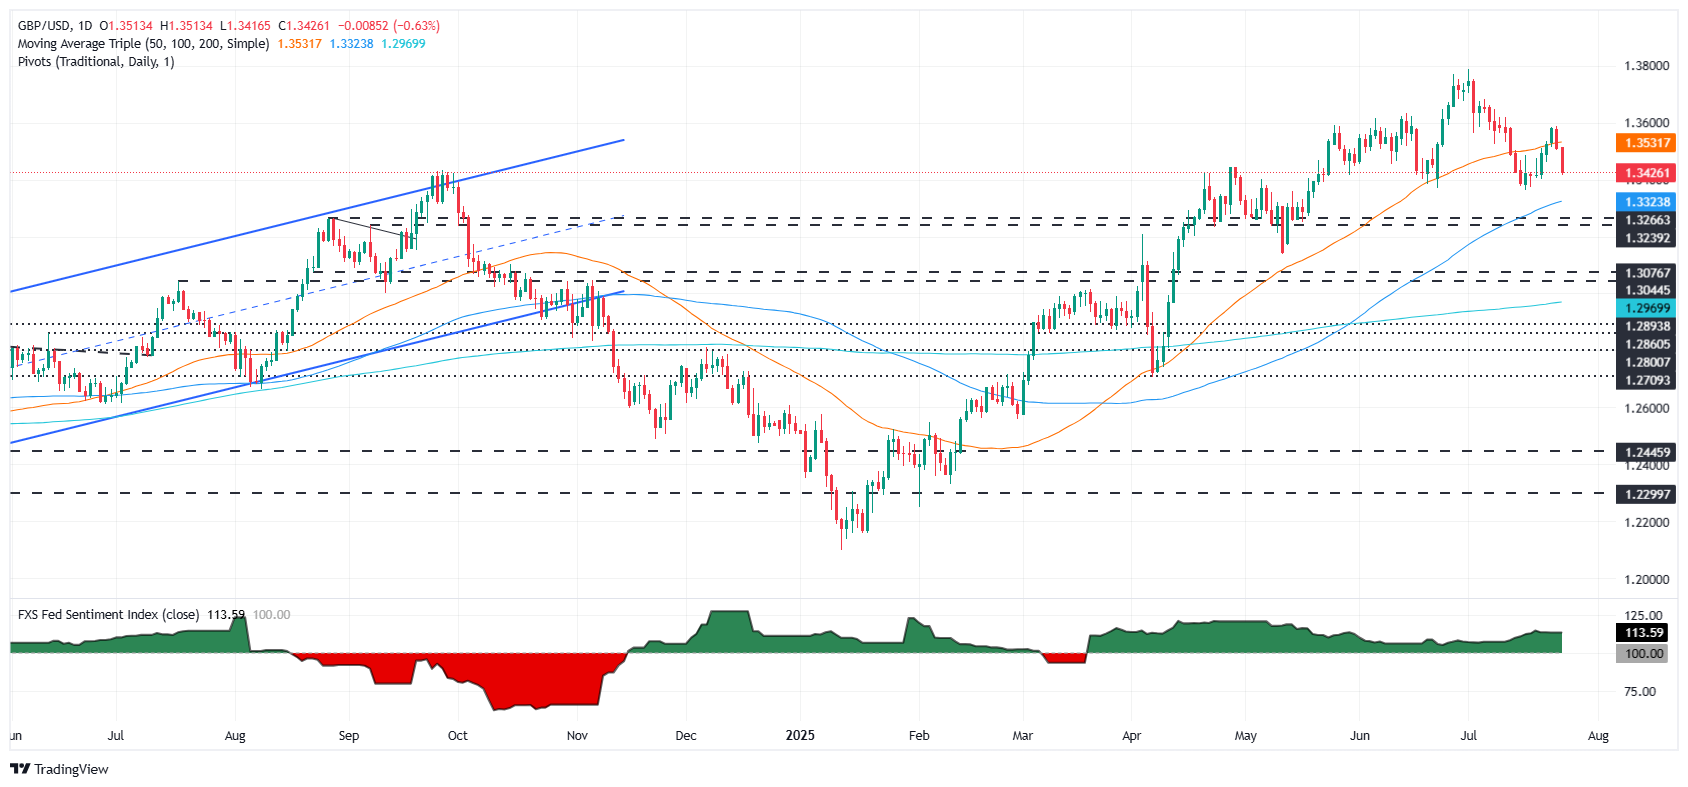
GBP/USD Price Forecast: Technical outlook
The GBP/USD remains upward biased even though it has cleared the 50-day Simple Moving Average (SMA) at 1.3527. The Relative Strength Index (RSI) turned bearish as sellers outpaced buyers in the last two weeks. That said, the pair could challenge the 1.3400 figure in the near term.
If cleared, the next support would be the June 23 swing low of 1.3369, followed by the 100-day SMA at 1.3320. On the other hand, if GBP/USD surges past the 1.3450 mark, a test of 1.3500 is likely.
British Pound PRICE This week
The table below shows the percentage change of British Pound (GBP) against listed major currencies this week. British Pound was the strongest against the US Dollar.
| USD | EUR | GBP | JPY | CAD | AUD | NZD | CHF | |
|---|---|---|---|---|---|---|---|---|
| USD | -0.80% | -0.06% | -0.15% | 0.02% | -0.56% | -0.55% | -0.58% | |
| EUR | 0.80% | 0.83% | 0.69% | 0.81% | 0.20% | 0.08% | 0.18% | |
| GBP | 0.06% | -0.83% | -0.34% | 0.03% | -0.59% | -0.53% | -0.45% | |
| JPY | 0.15% | -0.69% | 0.34% | 0.15% | -0.40% | -0.47% | -0.29% | |
| CAD | -0.02% | -0.81% | -0.03% | -0.15% | -0.52% | -0.56% | -0.65% | |
| AUD | 0.56% | -0.20% | 0.59% | 0.40% | 0.52% | -0.05% | 0.11% | |
| NZD | 0.55% | -0.08% | 0.53% | 0.47% | 0.56% | 0.05% | 0.09% | |
| CHF | 0.58% | -0.18% | 0.45% | 0.29% | 0.65% | -0.11% | -0.09% |
The heat map shows percentage changes of major currencies against each other. The base currency is picked from the left column, while the quote currency is picked from the top row. For example, if you pick the British Pound from the left column and move along the horizontal line to the US Dollar, the percentage change displayed in the box will represent GBP (base)/USD (quote).
Recommended Articles


